TRREB says the market “tightened” in May. That’s true, as far as it goes. It just isn’t the whole story.
- Sales rose 6.3% over last May (6,583 trades).
- New listings fell almost 19%.
- Active inventory thinned.
On paper, that’s a tightening market, and TRREB’s read is that prices should “flatten and ultimately trend upwards in the months ahead.” Maybe. But the same report shows the average selling price down 4.6% and the MLS HPI Composite down 6.7% year over year. So before we all agree the bottom is in, let’s look at what actually moved in May, and what didn’t.
The Big Picture: May 2026 by the Numbers
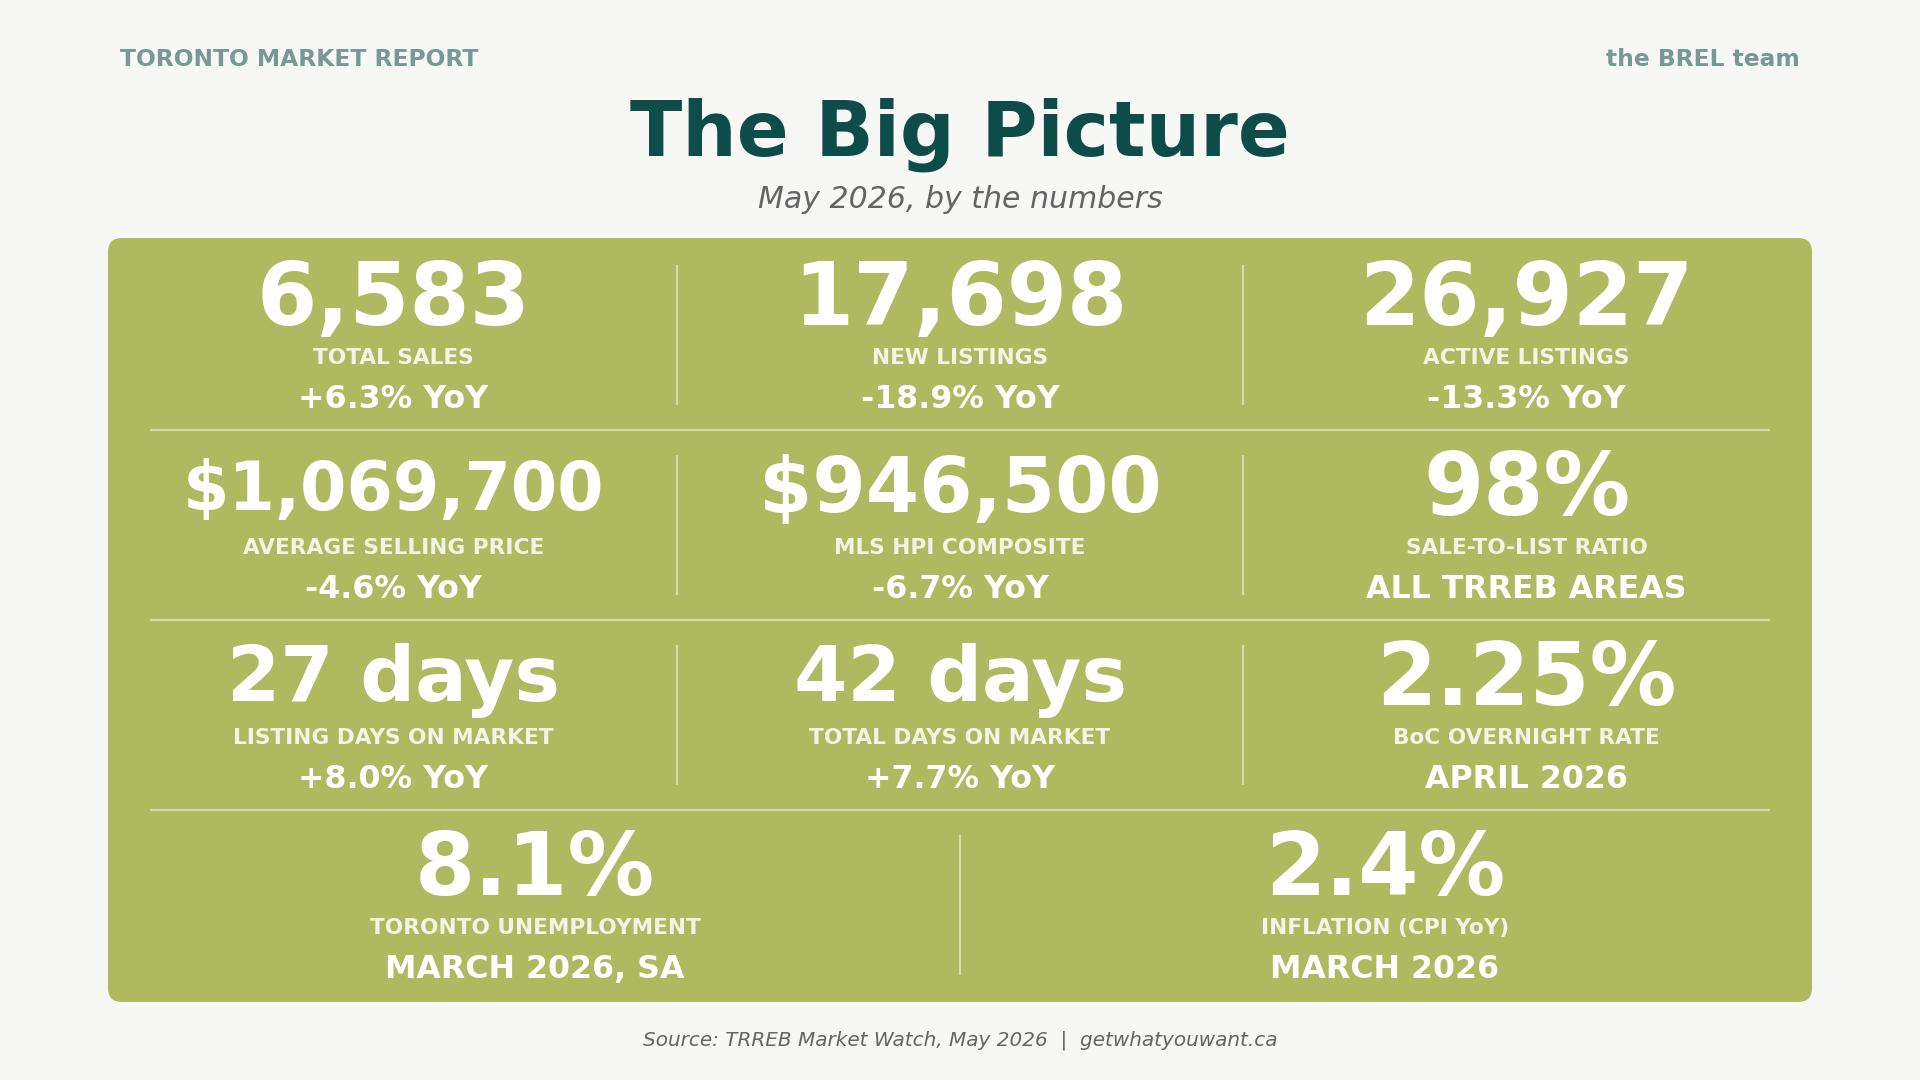
Year to date, 24,405 homes have traded across TRREB at an average of $1,032,238. That’s now within about 1% of the same five months of 2025 (roughly 24,650 sales), after running about 3% behind through April. May’s strong month nearly closed the gap. The volume is showing up. The prices still aren’t.
Five Things to Know About the May 2026 Stats
1. Sales are up, but buyers still hold the cards
More buyers turned up in May, and they bought at lower prices. Sales rose 6.3%, yet the HPI Composite is down 6.7% and the average price down 4.6%. With 4.8 months of inventory, this is a market clearing existing inventory, not one bidding prices back up. TRREB’s view that tighter conditions will push prices higher “in the months ahead” may eventually prove right, but May itself shows buyers negotiating from a position of strength, not chasing each other up the price ladder. The recovery so far is in how many homes sell, not what they sell for.
2. This “tightening” is a seller strike, not a buying frenzy
The market didn’t balance because buyers stampeded in. It balanced because sellers walked away. New listings fell 18.9% and active listings 13.3% year over year. That’s a big retreat in supply, and it’s doing most of the work in the sales-to-listings math. Plenty of would-be sellers looked at soft prices, decided this wasn’t their time yet and stayed put. A tighter market built on absent sellers is a very different animal from one built on hungry buyers, and it can loosen again the moment those sellers change their minds.
3. The average price is flattering the market
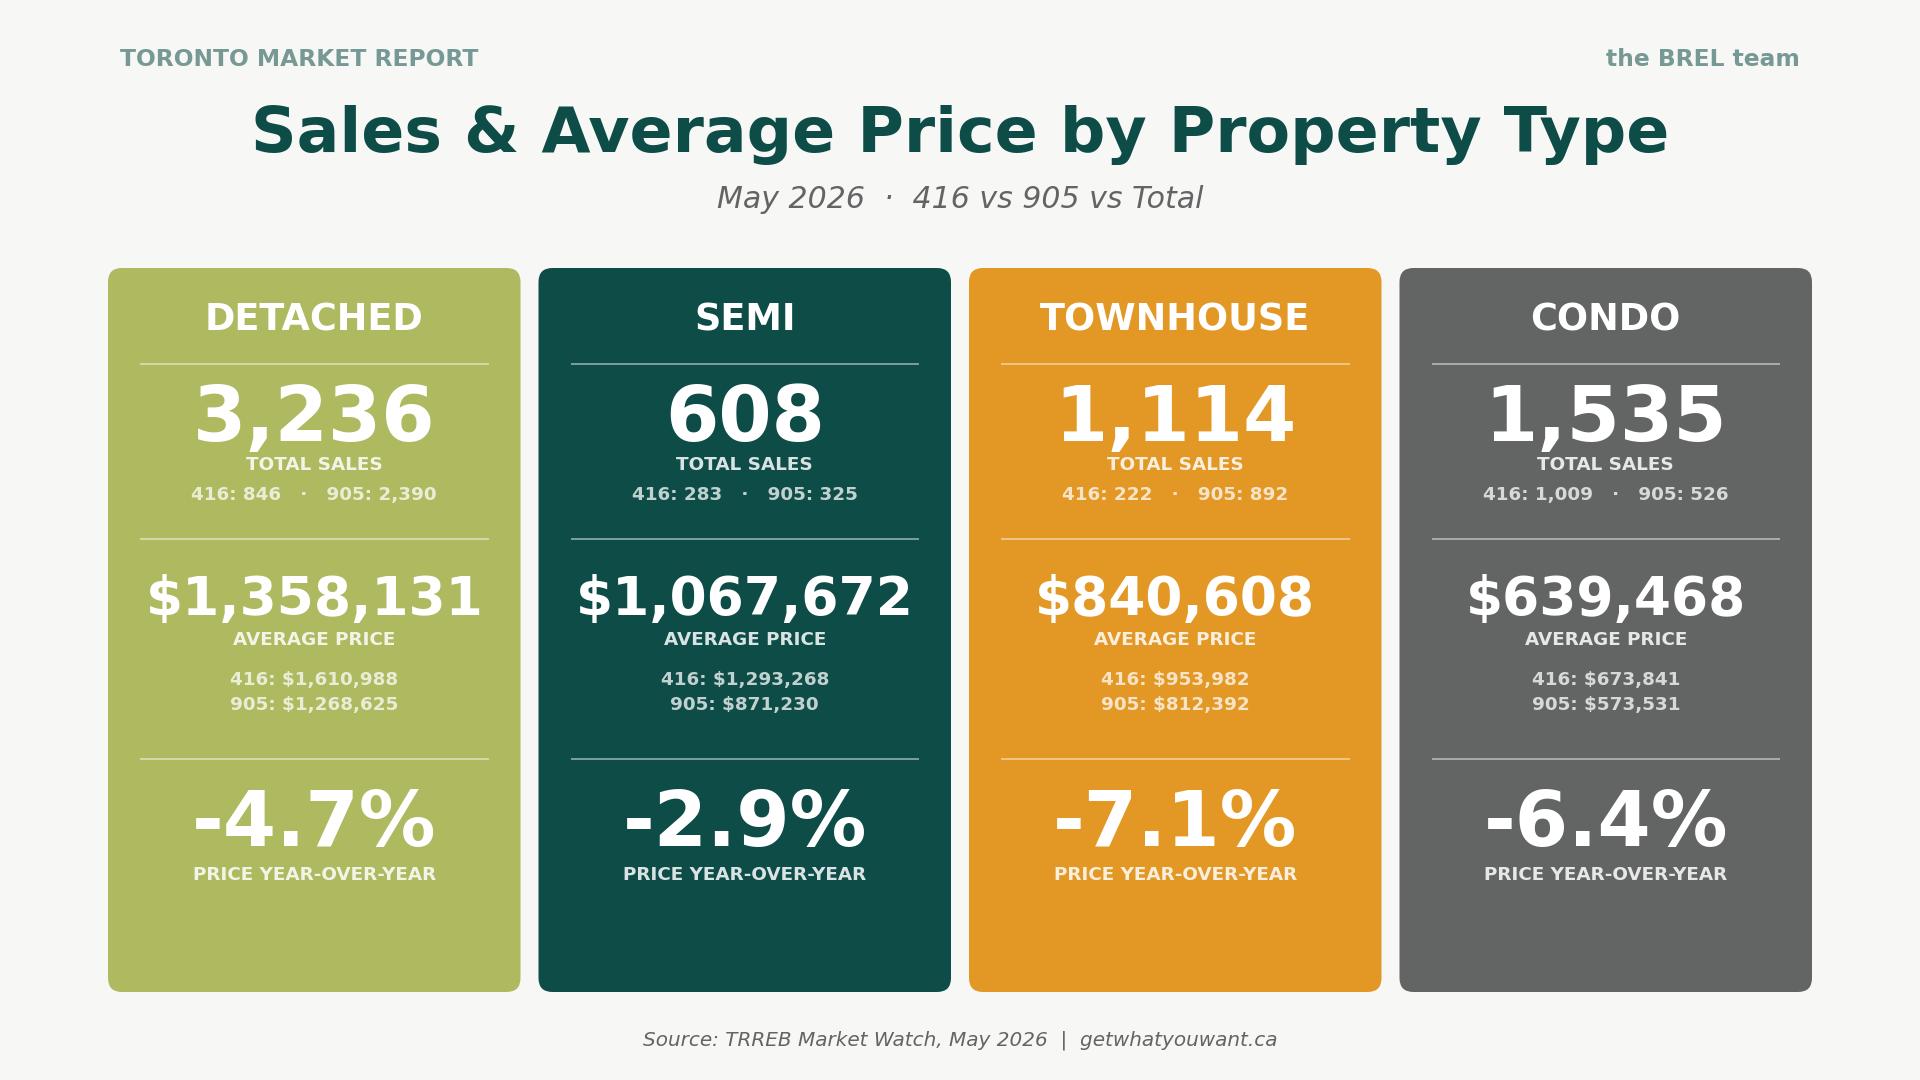
Watch the gap between the two price measures. The average selling price is down 4.6%, but the HPI Composite is down 6.7%. The difference is mix. Detached sales jumped 9% year over year, and detached is the most expensive property type on the board (a $1,358,131 average in May). When more high-ticket homes sell, they drag the average up, even when the value of a typical home is falling faster. The HPI compares like with like, so it strips out that noise.
4. The condo floor still hasn’t been found
Condo apartment sales rose 4.2%, which sounds like stabilization until you look at price. The average 905 condo sold for $573,531, down 9.5% year over year, the steepest drop of any segment-region combo on the report. At the neighbourhood level it’s worse: apartment benchmarks are down 11% to 19% across the west end (W01 apartments down a brutal 19.3%). This lines up with everything happening in the broader condo world, a frozen pre-construction market with no new launches in Q1, an investor base that has largely left the building, and rents at a four-year low. Buyers are showing up for condos because they’re cheap and getting cheaper, not because the segment has turned a corner.
5. “Toronto” is a dozen markets wearing one trench coat
The citywide numbers smooth over enormous variation. In May, the E02 detached benchmark (the Beach and Upper Beaches) fell 16.1% year over year, while the C08 detached benchmark (St. Lawrence, Cabbagetown) actually rose 0.5%. E01 (Riverdale, Leslieville) held its composite nearly flat at down 1.1%, while W03 (Weston, Mount Dennis) dropped 10.6%. Same city, same month, results pointing in opposite directions. If you’re making a decision based on “the Toronto market,” you’re reading the wrong map. The only number that matters is the one for your property type, on your block.
Neighbourhood Prices: What the HPI Data Tells Us
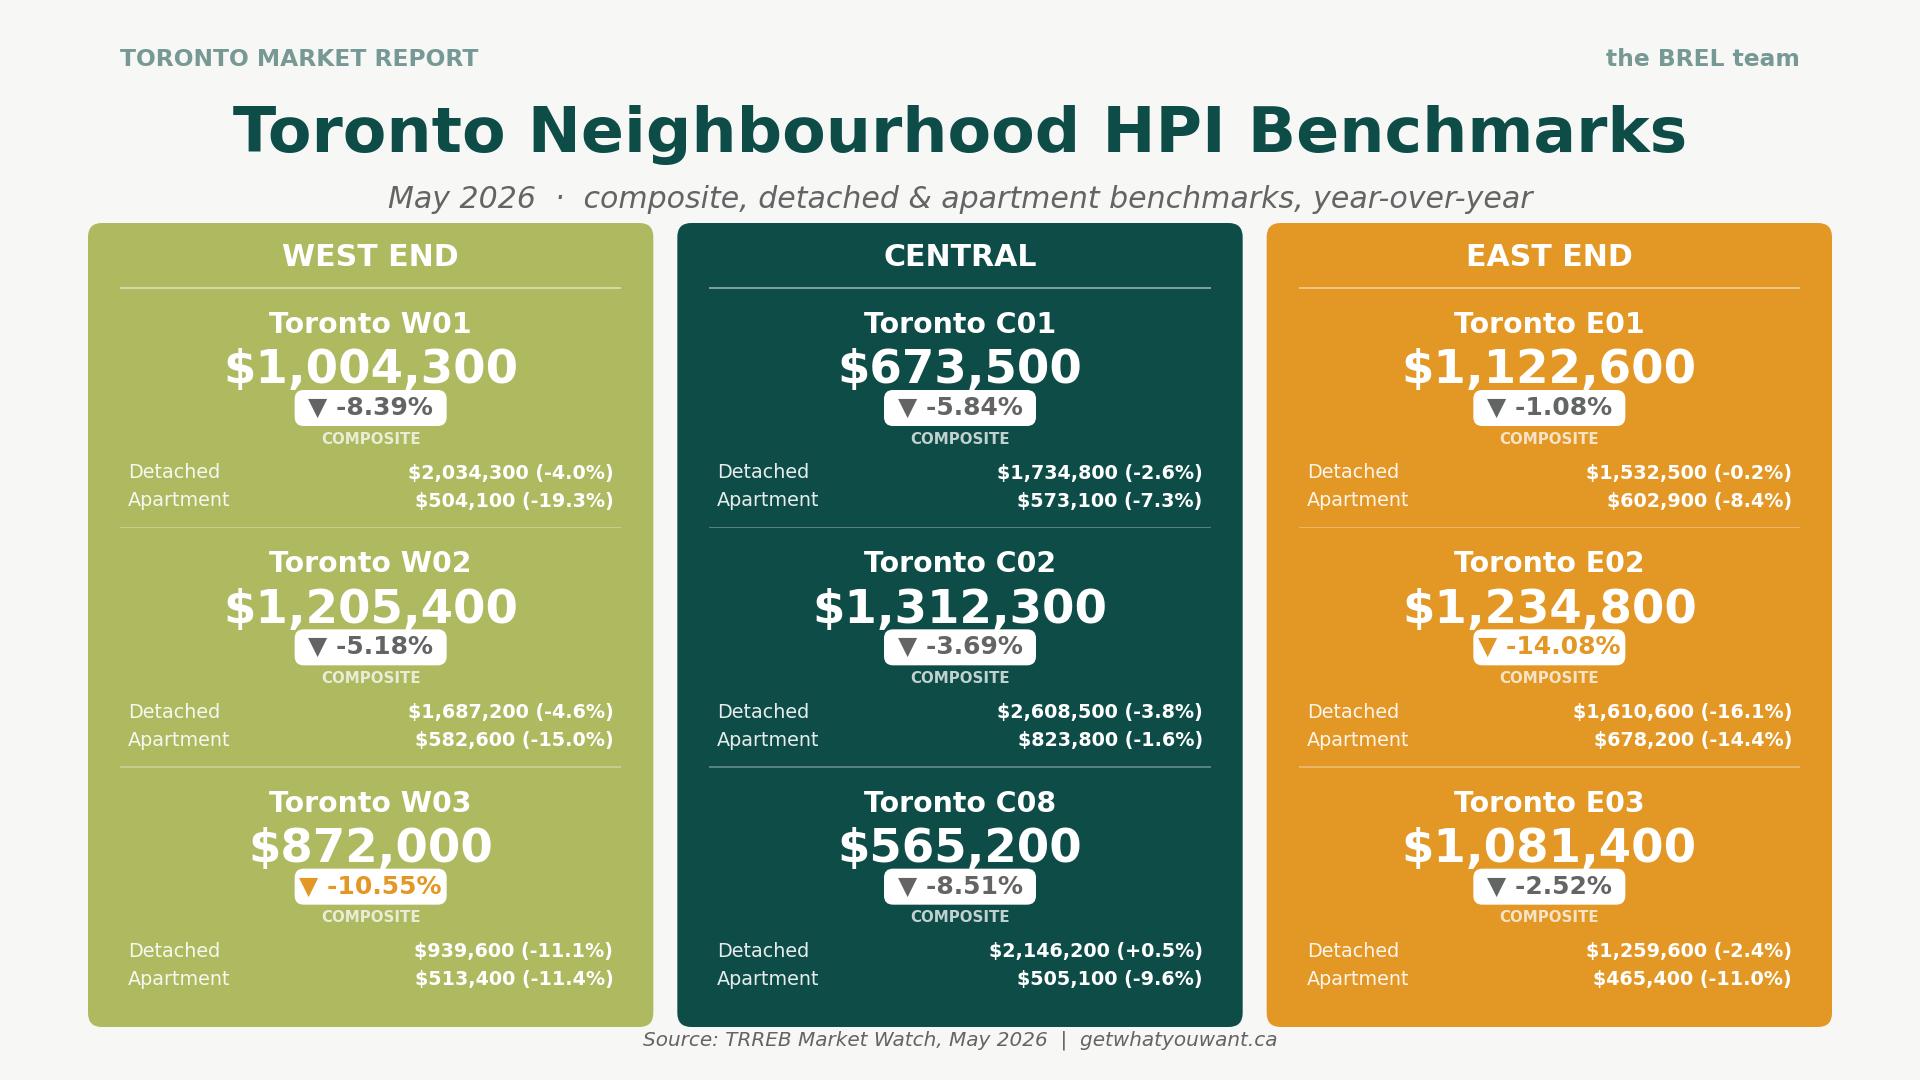
Quick refresher on why we use the HPI and not average prices for neighbourhood comparisons. The average price just tells you what happened to sell that month. If a handful of multimillion-dollar homes trade and the little condos sit, the average jumps, and it tells you nothing about whether prices actually moved. The MLS Home Price Index tracks a benchmark “typical” home in each area over time, so it filters out that mix-shift noise. For comparing how a neighbourhood is really moving, the HPI is the cleaner signal. The numbers below are May 2026 benchmarks and their year-over-year change.
West End: W01, W02, W03
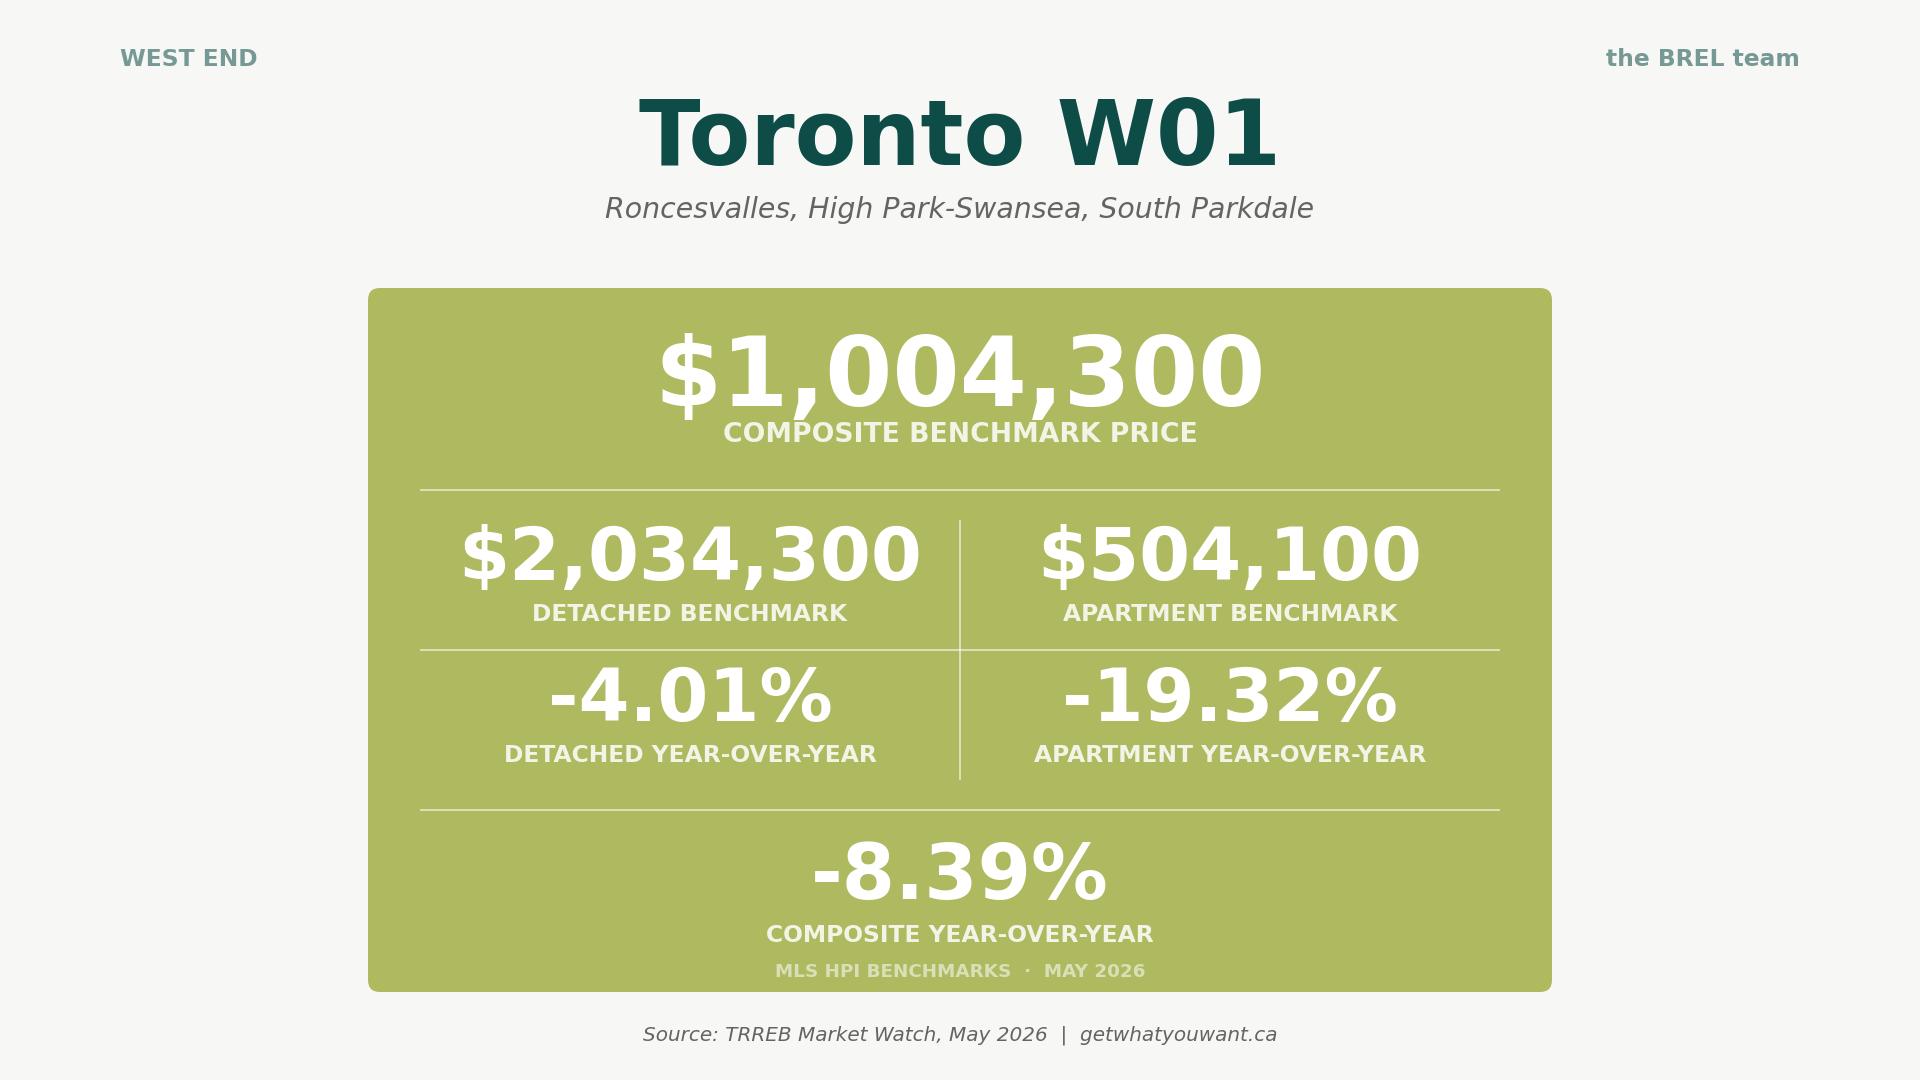
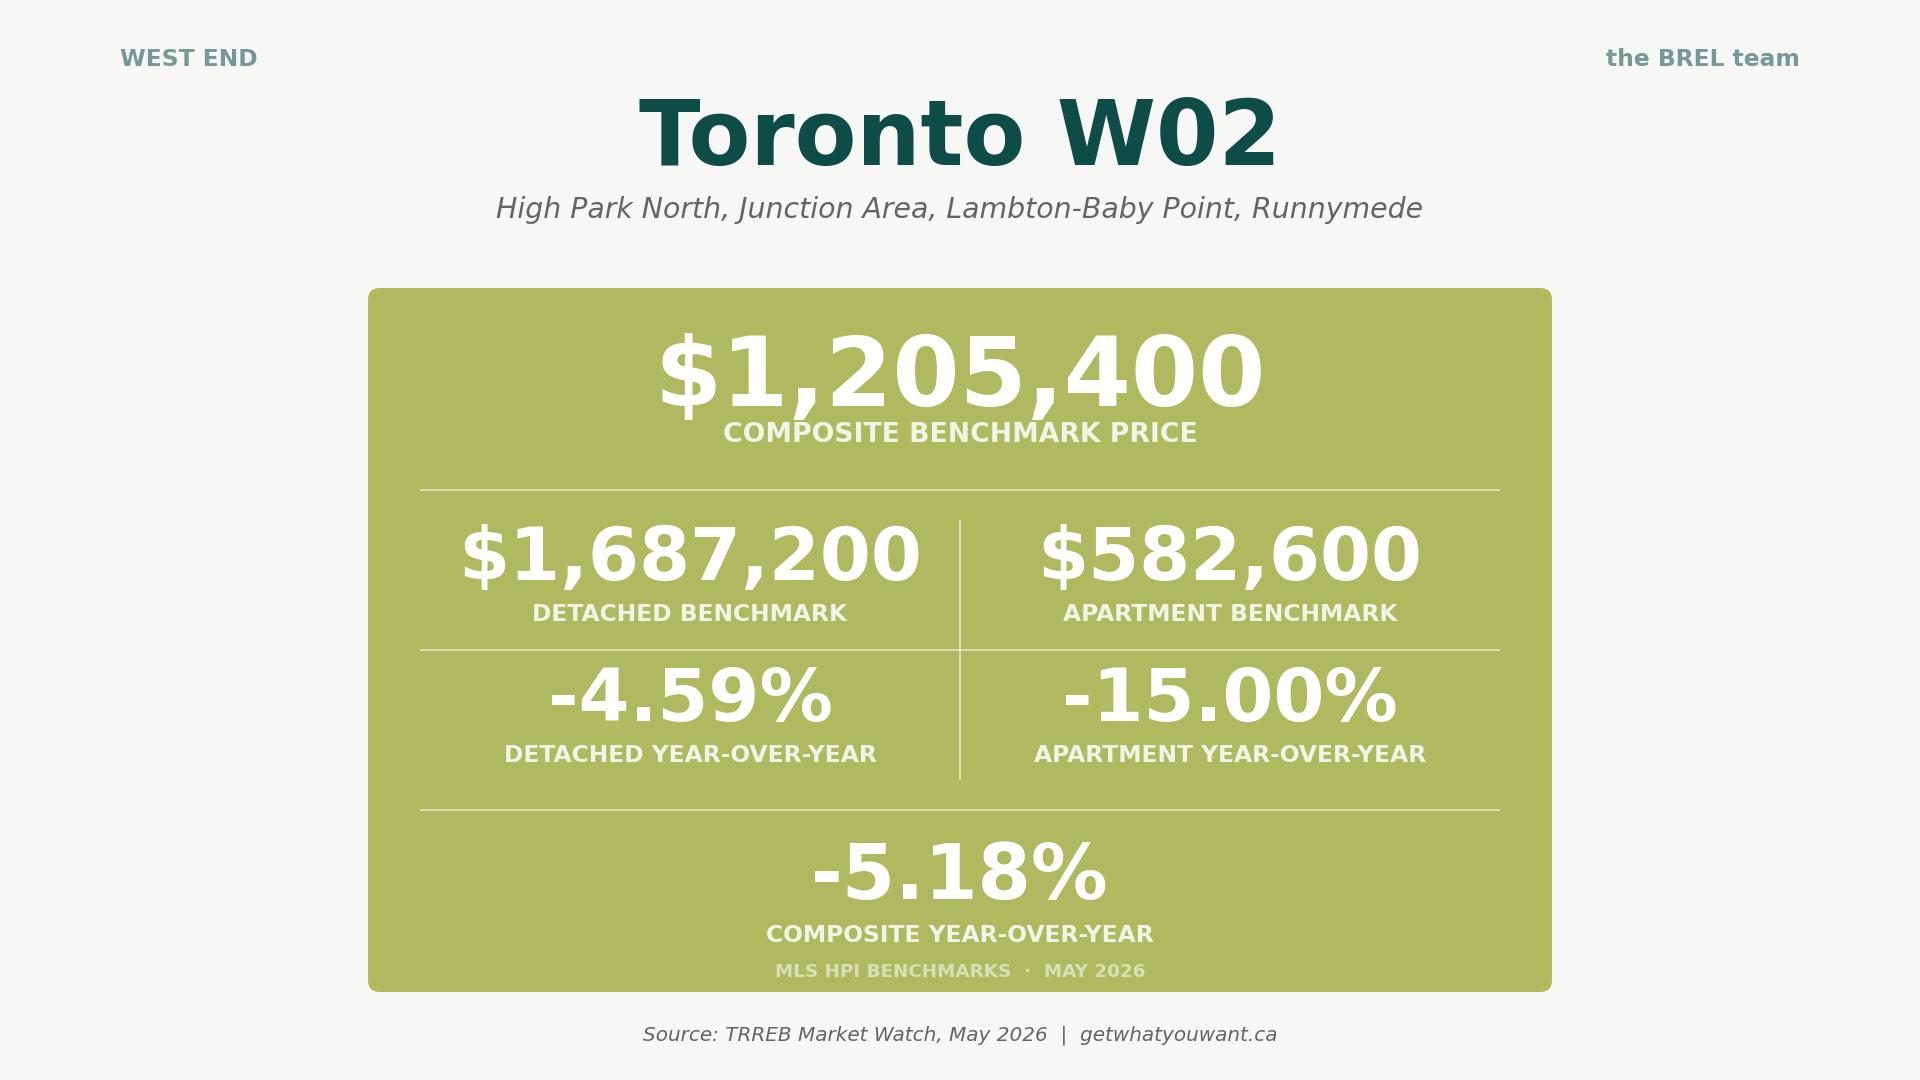
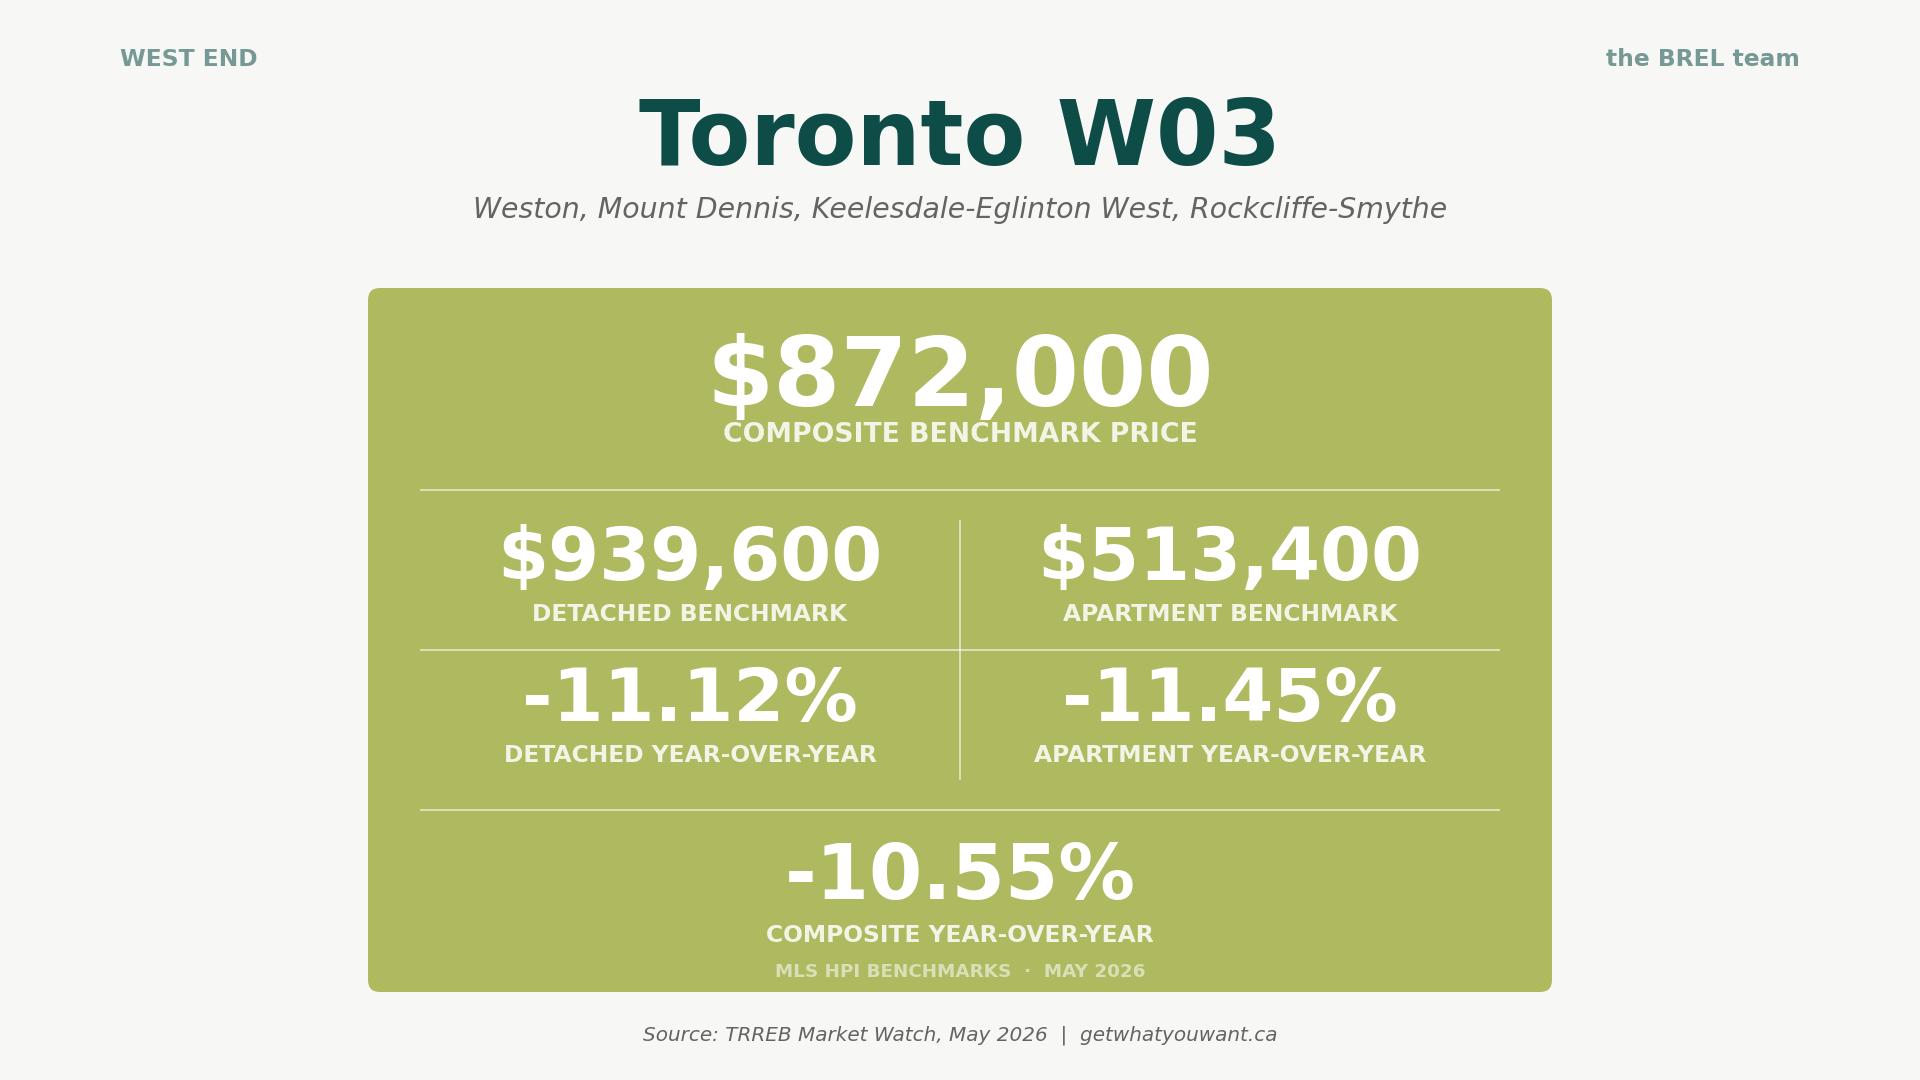
Takeaway: The west-end split is stark. Detached homes in W01 and W02 are holding up reasonably (down 4 to 5%), but the apartment market is not, down 15% in W02 and more than 19% in W01. That is the single largest drop in our nine-neighbourhood scan, and it is a genuine opening for a buyer who has been priced out of Roncesvalles or High Park. W03 is softer across every type, which is the pattern in less heated pockets when the broader market drifts.
Central: C01, C02, C08
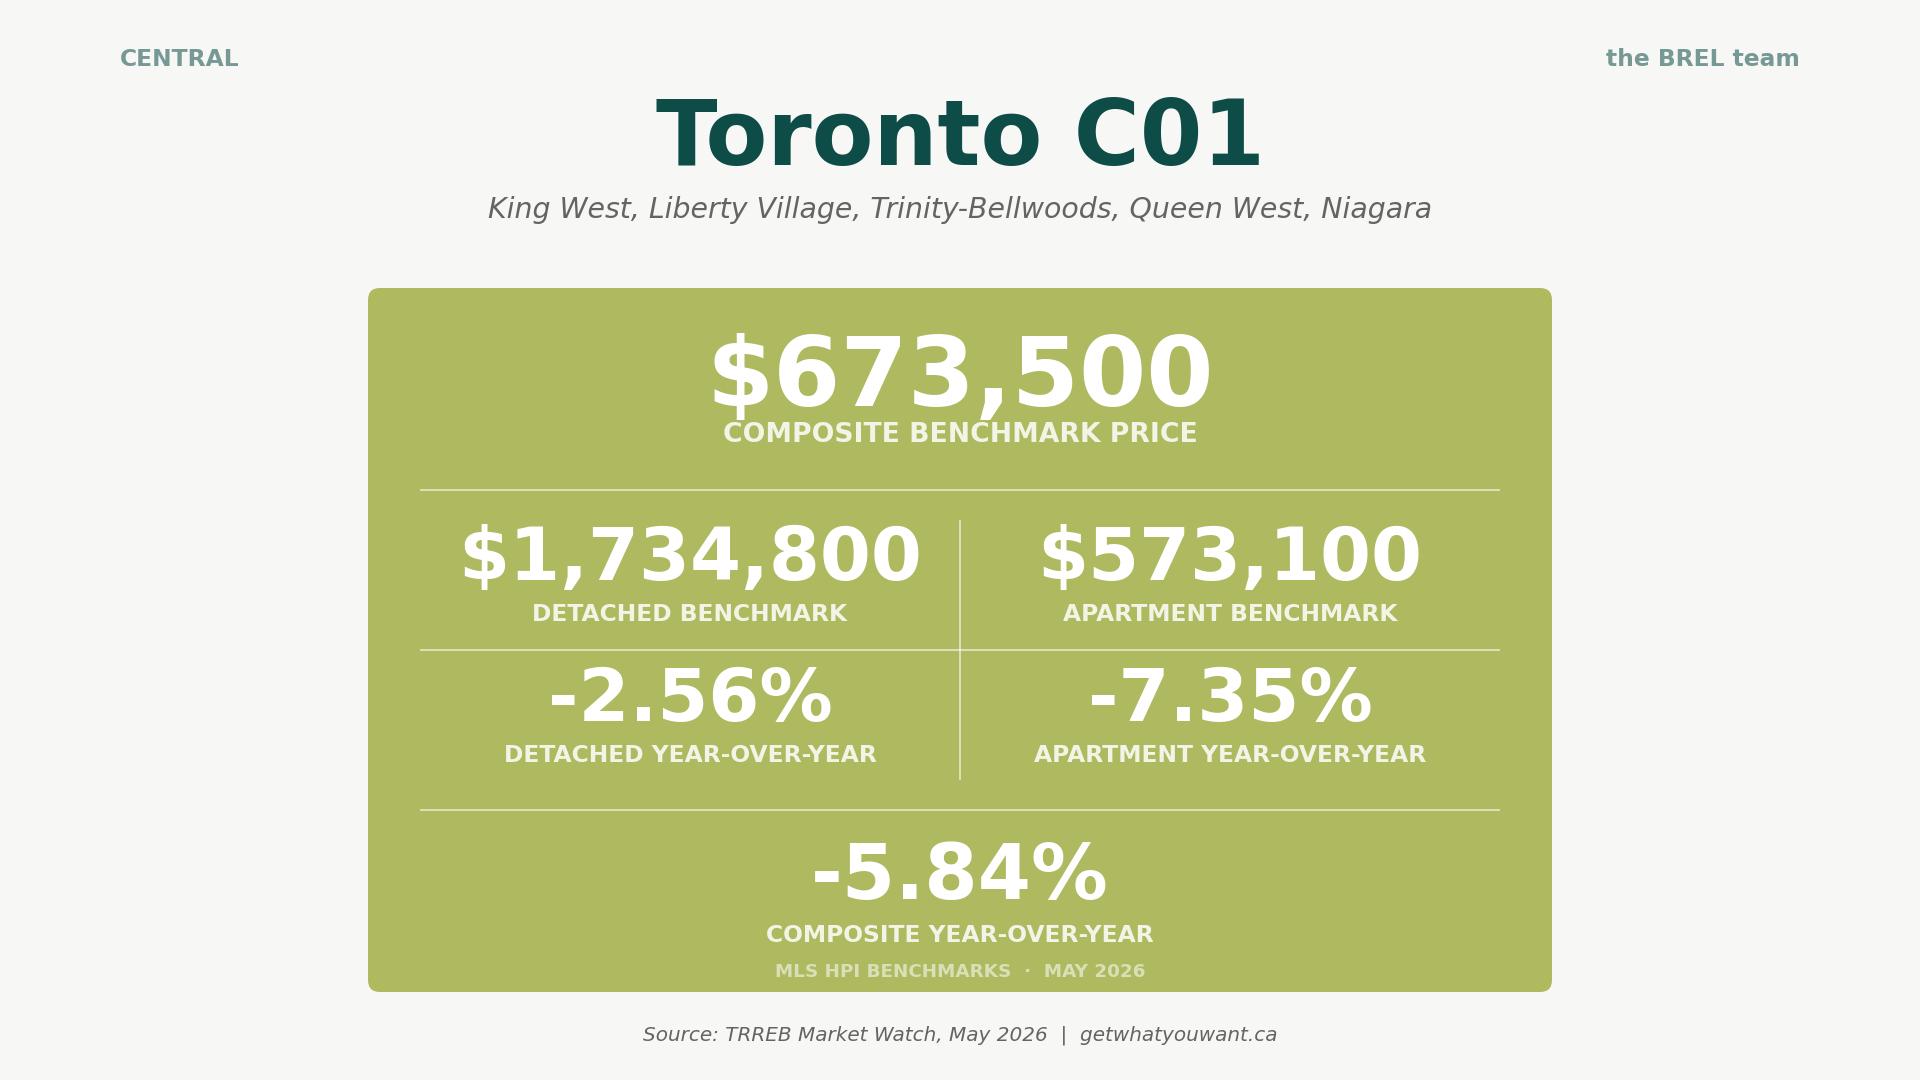
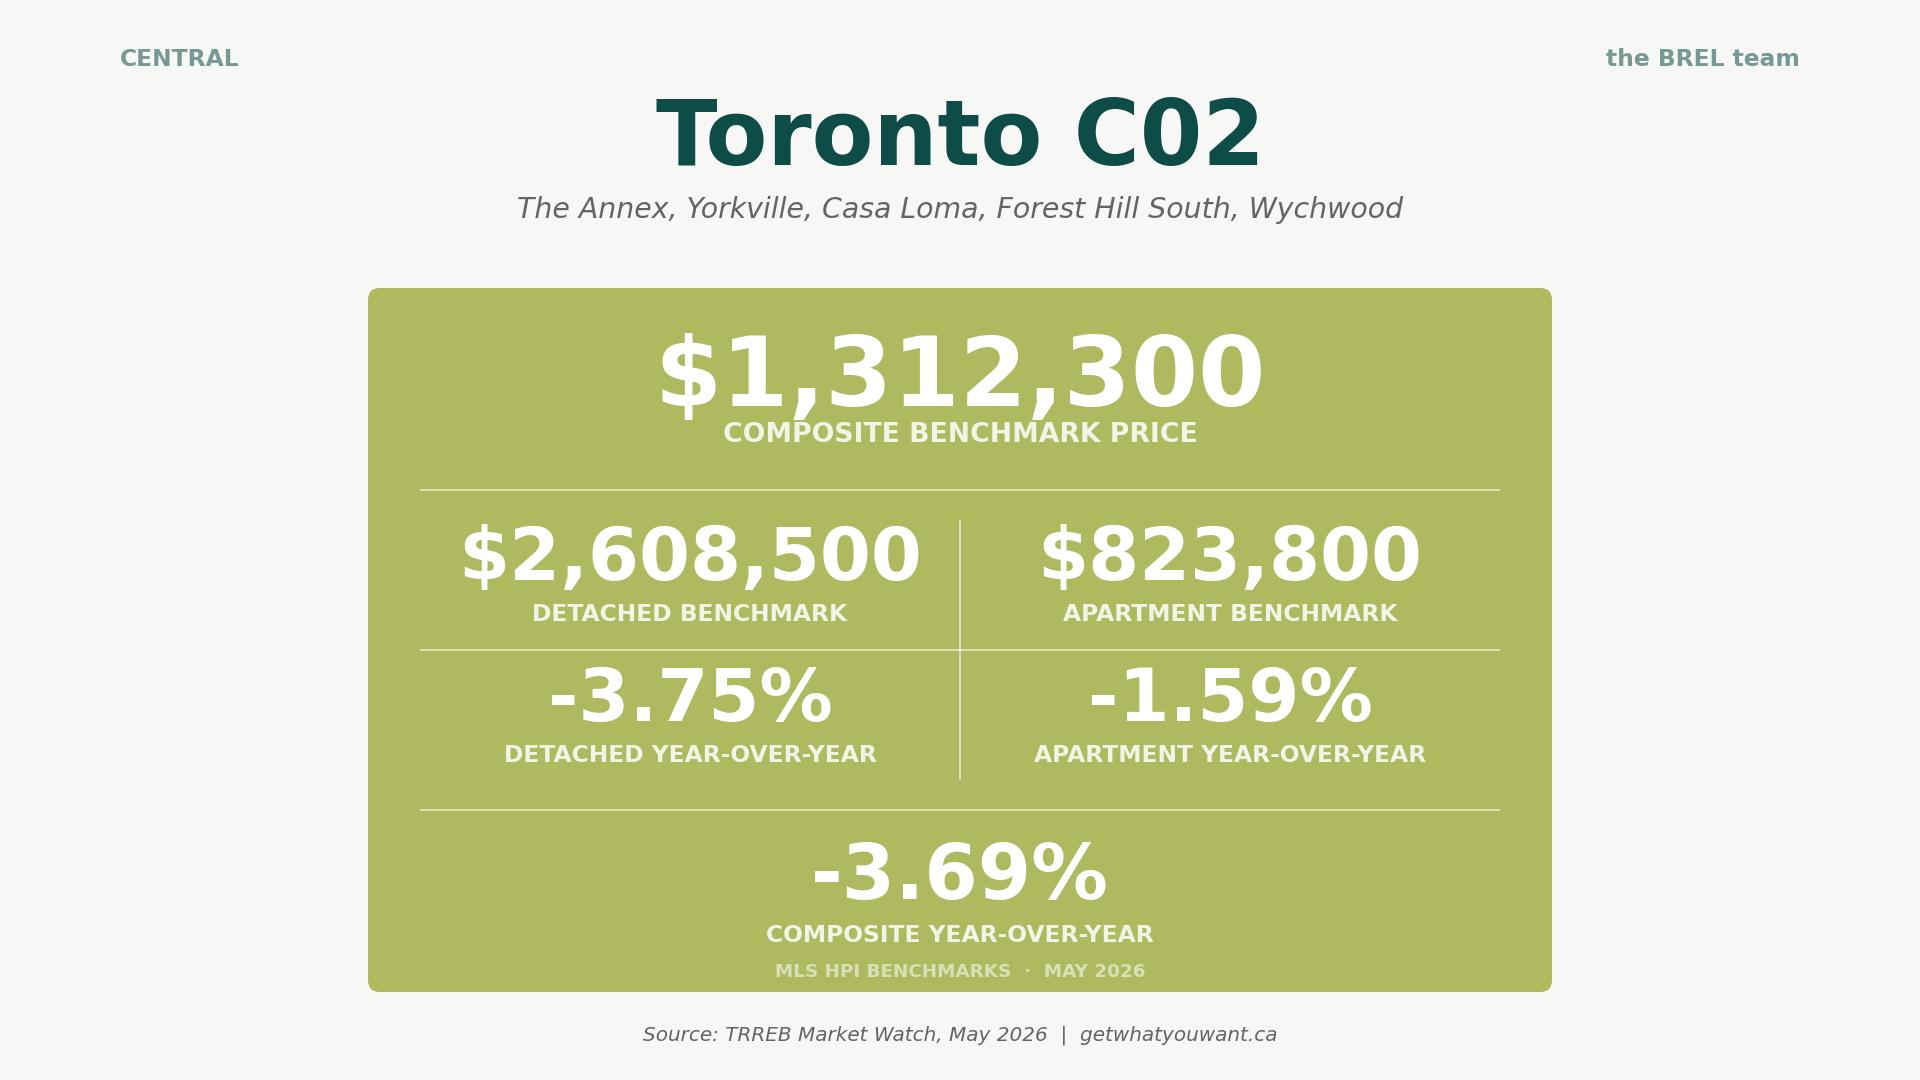
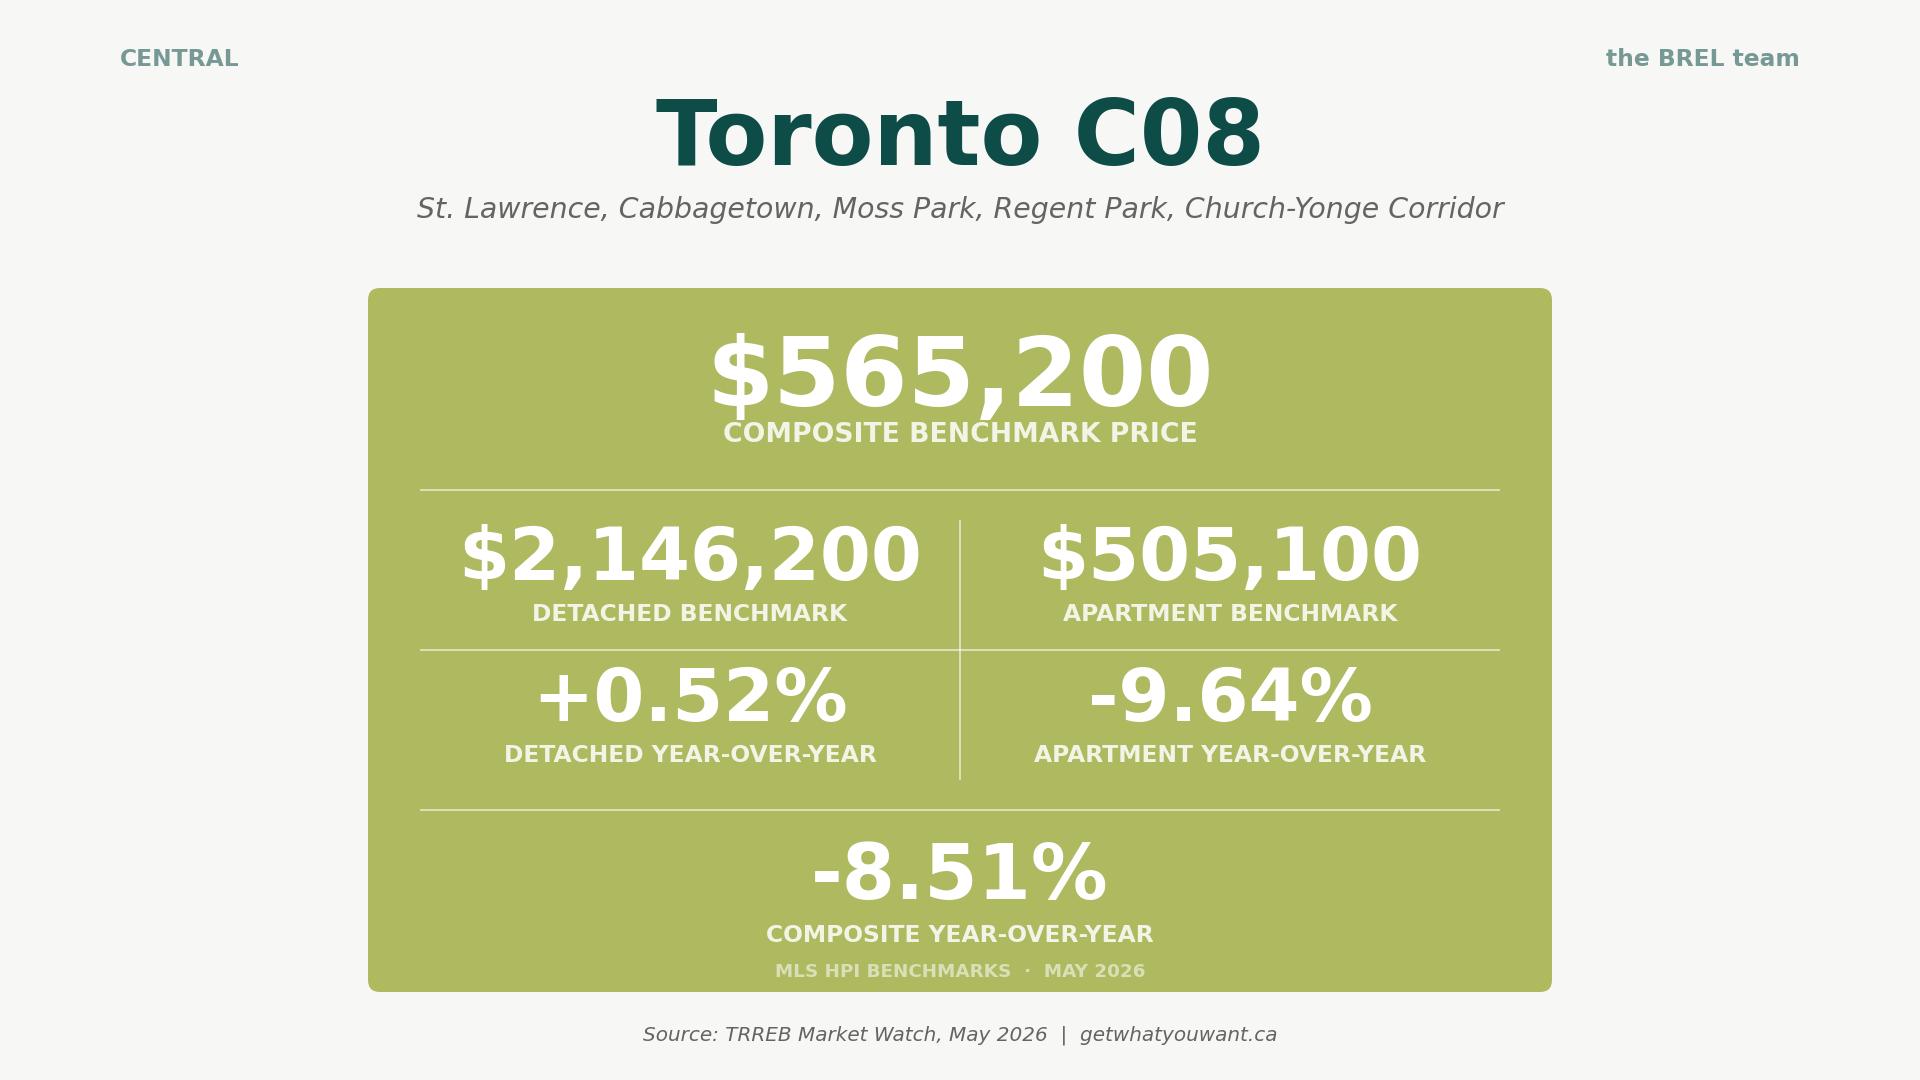
Takeaway: Central Toronto is the most resilient on the price side, which makes sense given how much of it is core, supply-starved, and chronically in demand. C02’s detached and apartment benchmarks are both down less than 4%, and C02 apartments (down 1.6%) are the steadiest condo number anywhere in this report. C08 is the odd one, with a tiny detached pool nudging up 0.5% while its condo-heavy composite drops 8.5%. Treat the C08 detached figure with appropriate skepticism, it’s a small sample. For buyers, central Toronto is where the discounts are smallest, which tells you something about where confidence still lives.
East End: E01, E02, E03
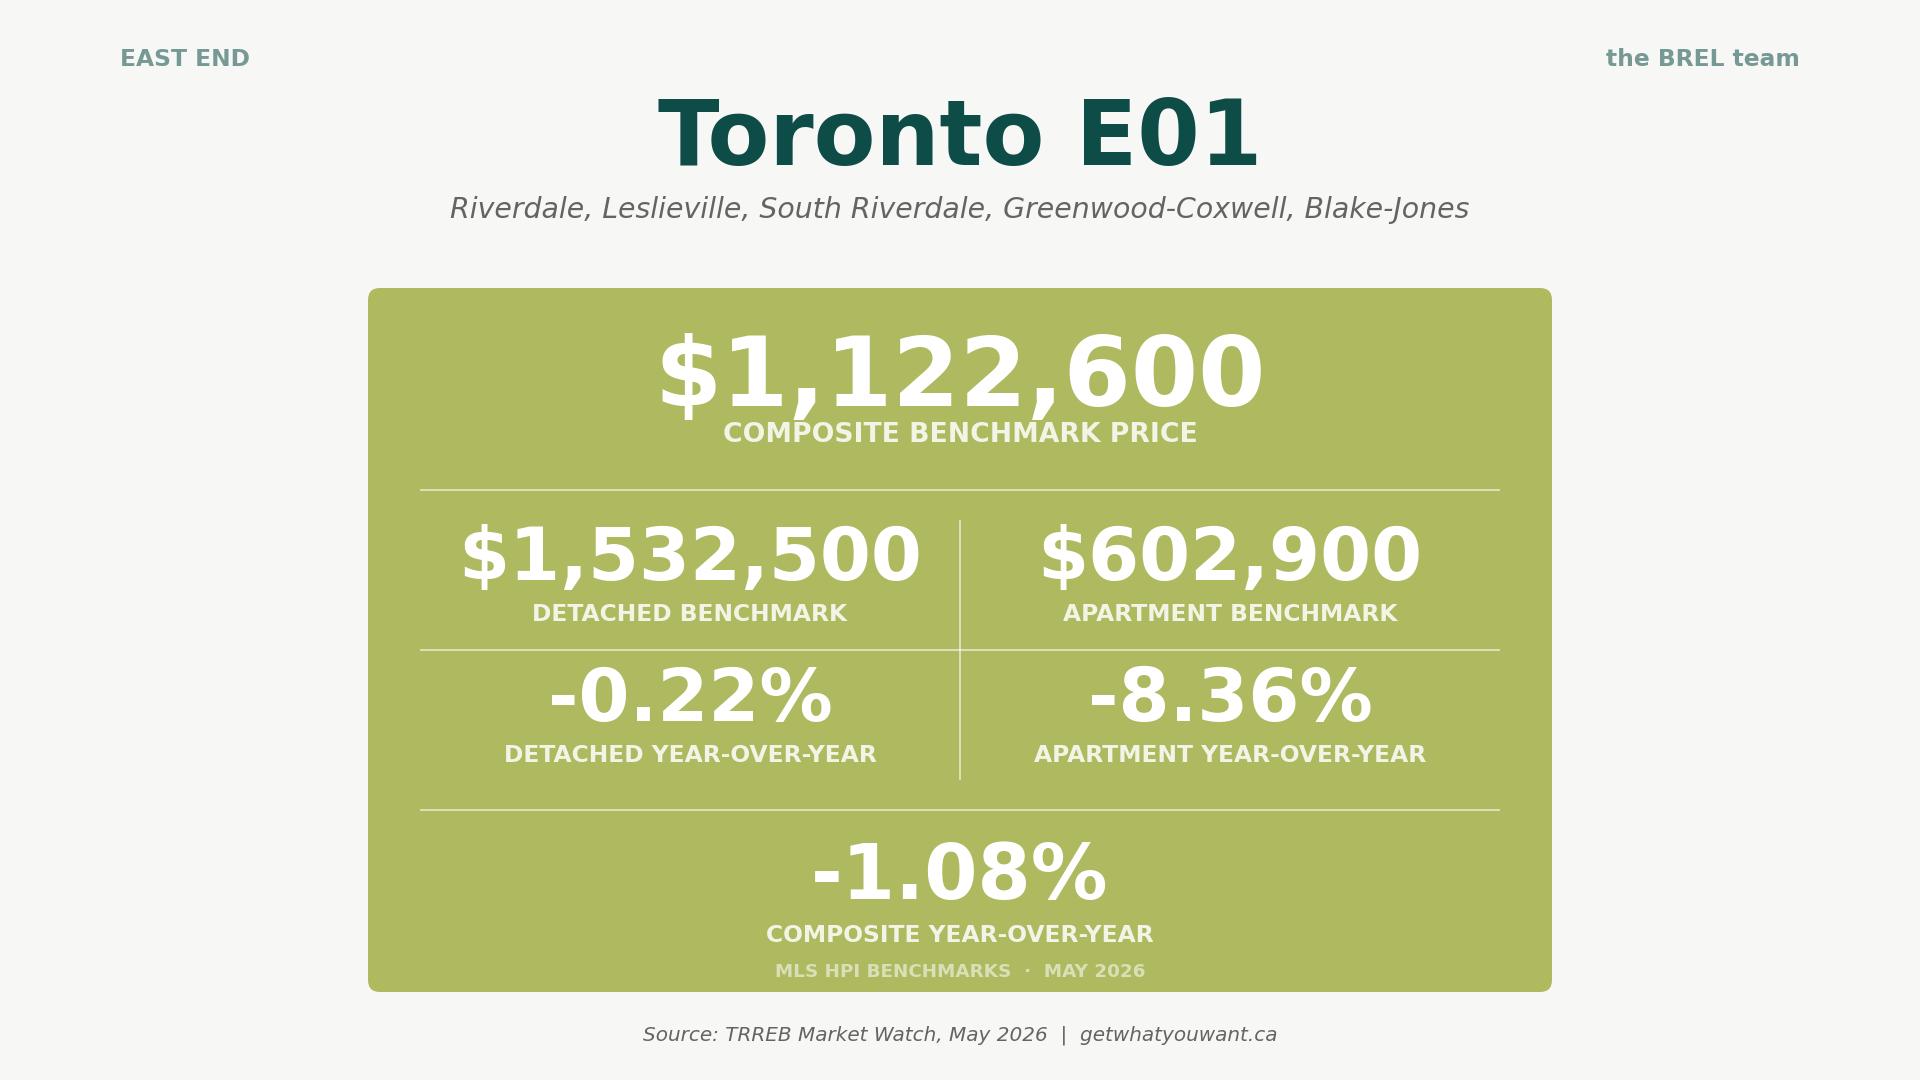
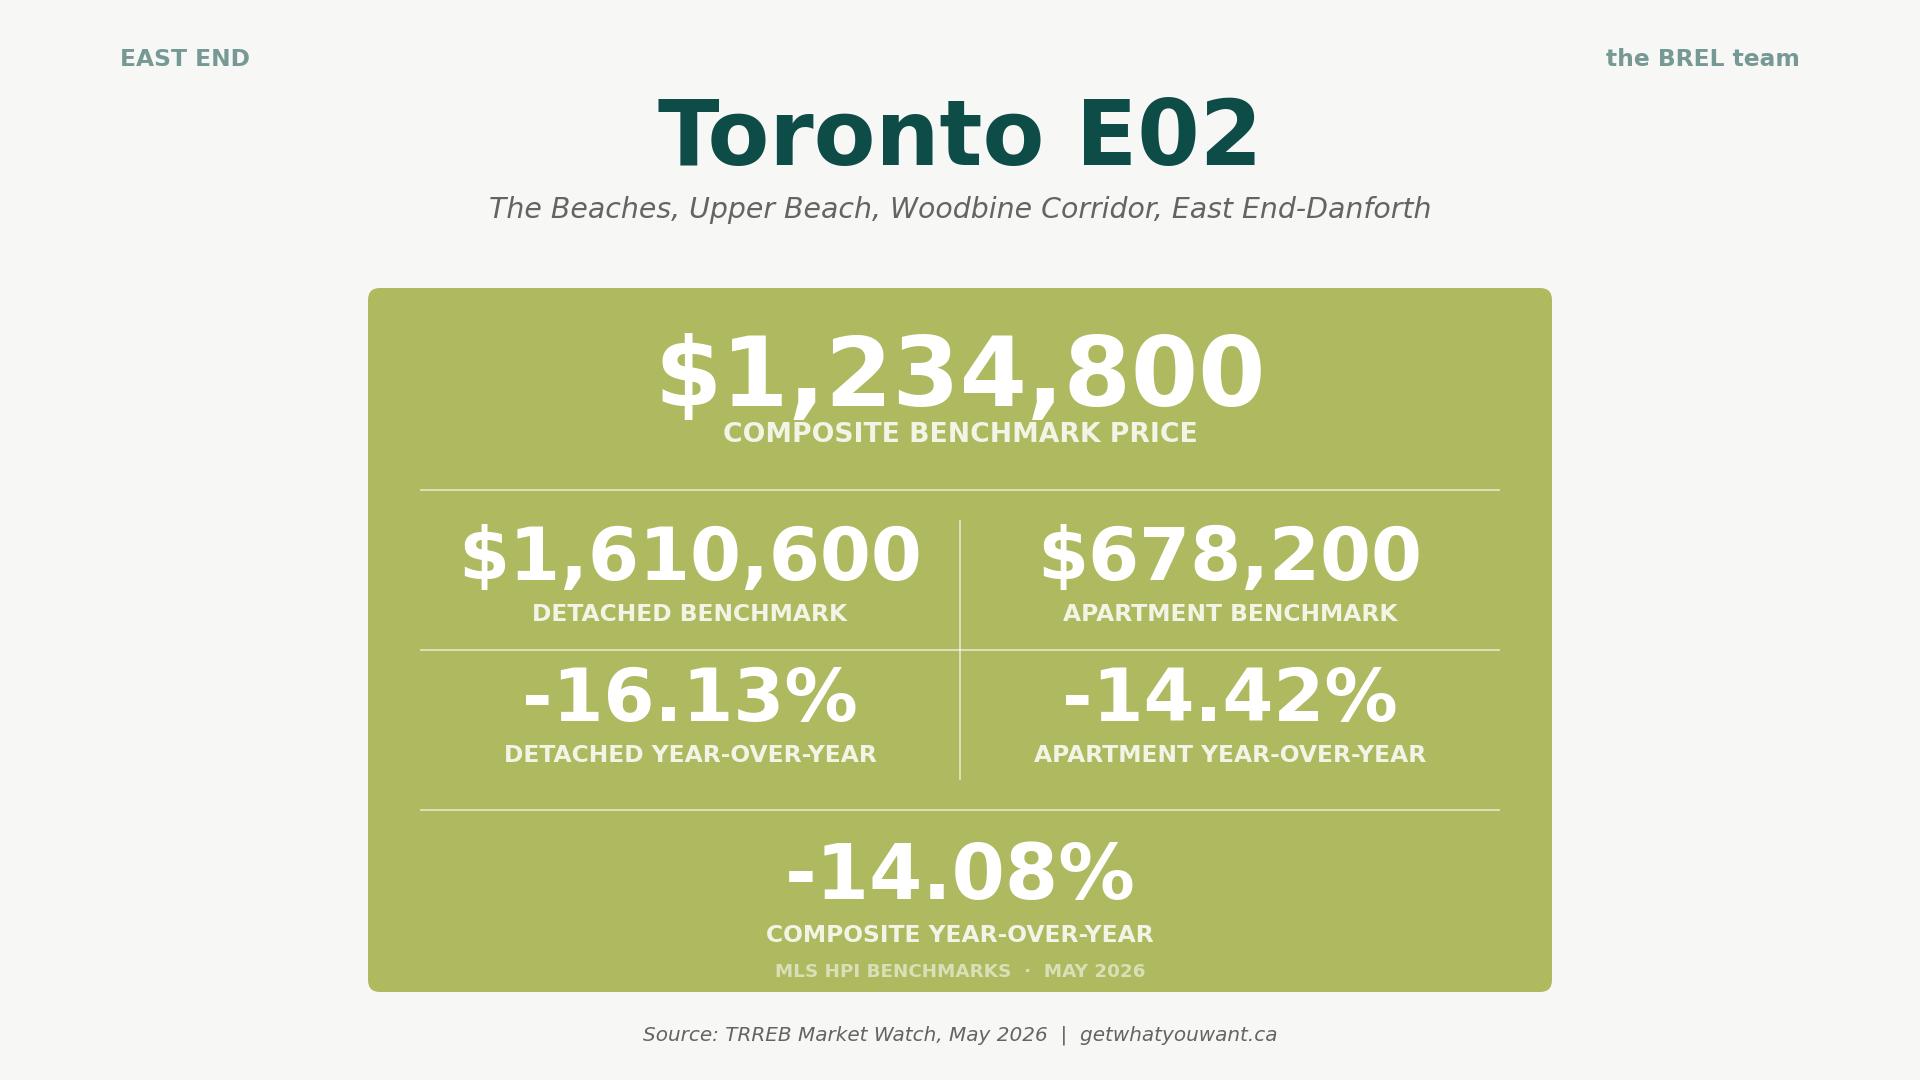
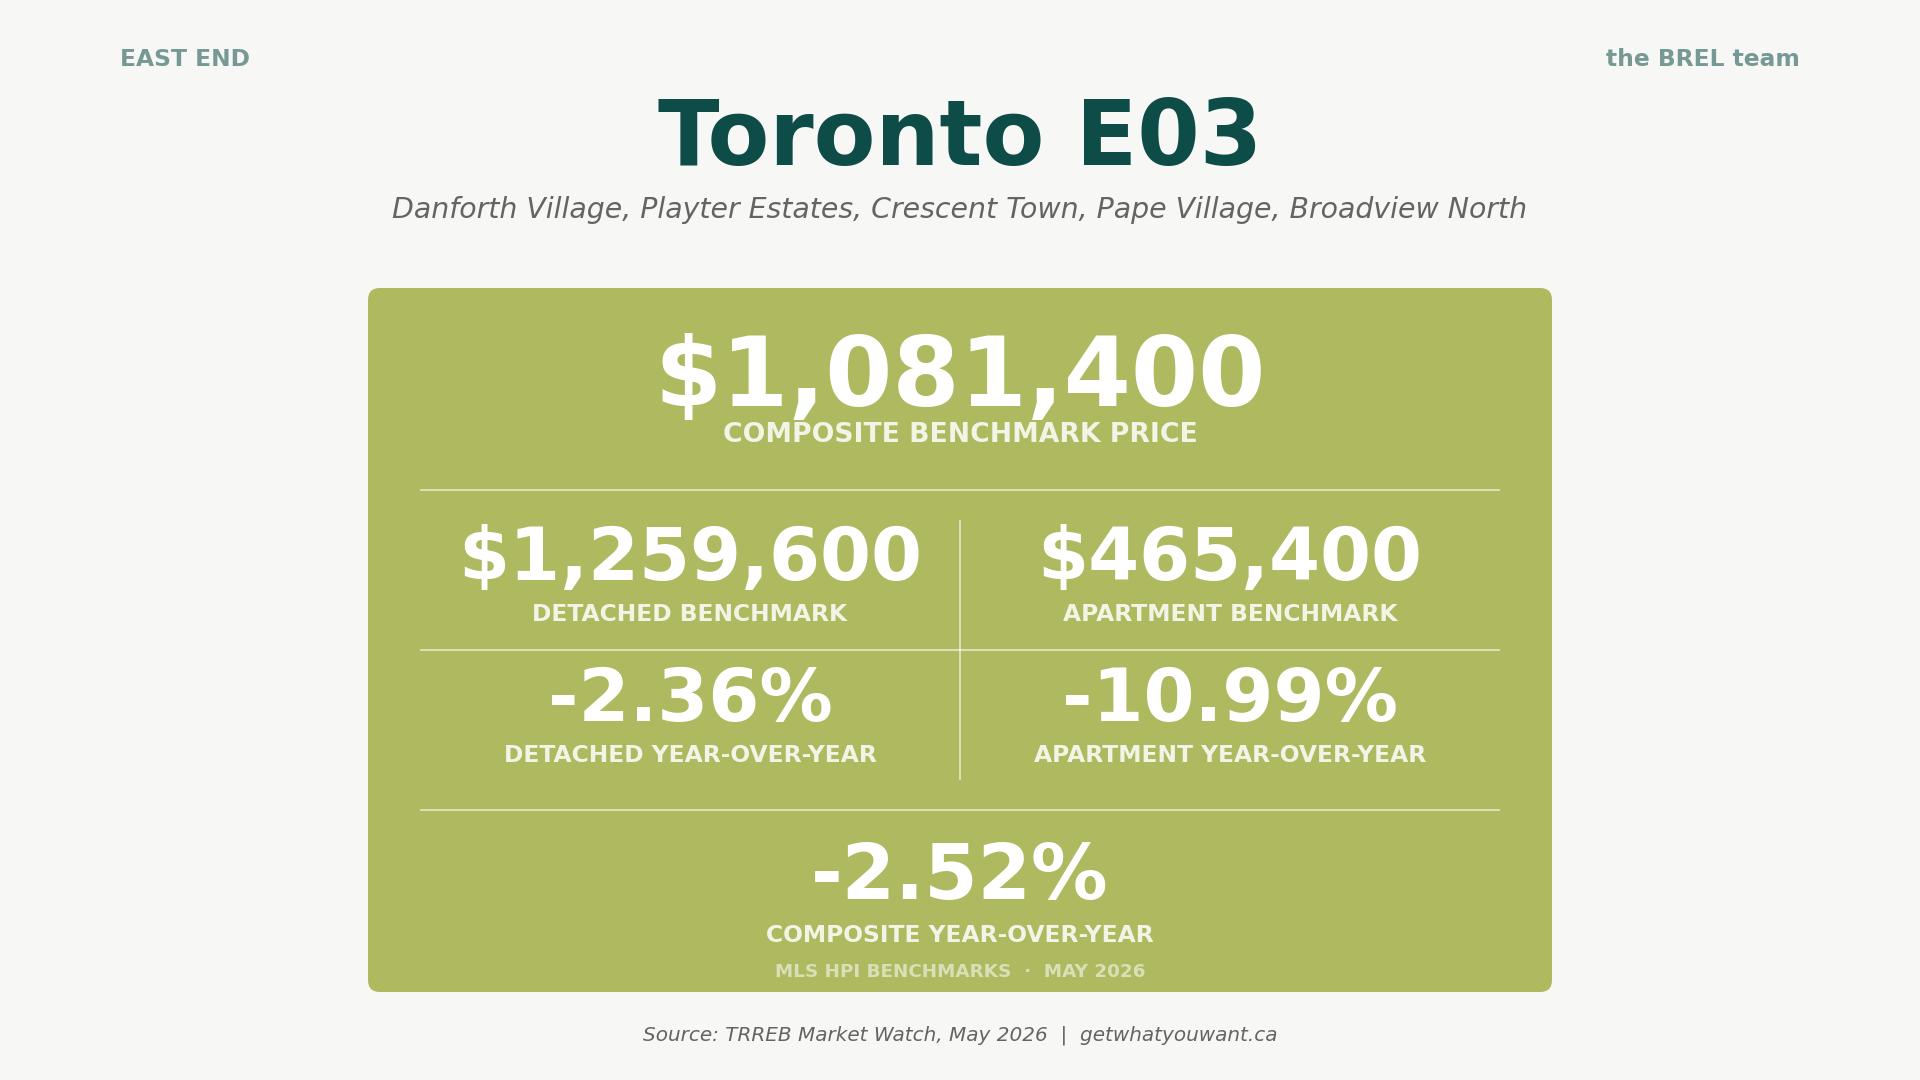
Takeaway: The east end contains both the best and the worst stories in the city. E01’s detached benchmark is essentially flat, the most resilient detached pocket in our scan, and proof that buyers still pay up for the Riverdale-Leslieville package of transit, schools, and character homes. E02, two neighbourhoods over, is the deepest correction anywhere on this list, with detached down more than 16% and every property type off double digits. If the long-term thesis on the Beach still holds (and we think it does), that is the kind of move that creates real opportunity. E03 sits quietly in the middle, with its apartments the only soft spot.
What Else You Need to Know
Bank of Canada holds at 2.25%, with June 10 next
The Bank held its overnight rate at 2.25% on April 29, 2026, leaving prime at 4.5%. The next decision lands June 10, and bond markets are pricing another hold. The Bank has signalled that both cuts and hikes remain on the table depending on how trade and energy risks play out. For variable-rate borrowers, the message is steadiness rather than relief.
Federal first-time buyer GST rebate is now in effect
Bill C-4 received Royal Assent on March 12, 2026, and the First-Time Home Buyers’ GST Rebate is live. It removes the federal GST on a qualifying new build priced up to $1 million for eligible first-time buyers (a maximum saving of $50,000), phasing out to $1.5 million. It applies to new construction only, with the purchase agreement dated on or after March 20, 2025.
Ontario’s Bill 98 takes aim at the cost of building
Introduced March 30, 2026, the Building Homes and Improving Transportation Infrastructure Act standardizes municipal planning rules, adds development-charge disclosure on purchase agreements, and pairs with a roughly $8.8 billion federal-provincial deal to cut development charges. TRREB publicly backs it. The goal is cheaper, faster homebuilding; critics argue it strips municipalities of useful tools. Either way, it’s aimed at new supply, so resale buyers won’t feel it directly for a while.
The pre-construction condo market is still frozen
For the first time in more than 30 years, the GTA saw no new condo launches in Q1 2026. Developers are asking around $1,189 per square foot for new standing inventory, a record 38% premium over comparable resale at roughly $859. Investor demand has evaporated, and completions are forecast to fall to about 21,850 units in 2026 from nearly 30,000 the past two years. Today’s freeze becomes tomorrow’s supply shortage.
Rents are at a four-year low
Ontario rents are down 4.7% year over year, the steepest drop in the country, and GTA average rents have slid to a four-year low. Toronto’s rental vacancy rate has climbed to around 4.2%, up from roughly 1.5%, on the back of record purpose-built completions and slower immigration. Great news for tenants. For investor-owners, it’s another reason the condo math doesn’t work right now, which loops straight back to the soft condo prices above.
Advice for Toronto Buyers
The data has been telling you for months that prices are lower than they were, and May didn’t change that. The HPI Composite is down 6.7% from a year ago. Some condo benchmarks are off 15% to 19%. Detached in pockets like E02 is down 16%. That is real, measurable, balance-sheet-moving room to negotiate.
But “lower than last year” is not the same as “still falling fast.” On a seasonally adjusted basis, May’s average price actually ticked up slightly from April, and sales rose 10% month over month. The drift may be levelling in the areas where buyers are already showing up. Waiting for a dramatic further drop is a bet, not a plan.
Three practical moves this season:
- If you’re a first-time buyer looking at new construction, run the federal GST rebate math, up to $50,000 is not a rounding error.
- Get a real pre-approval, because the rate market is steady rather than falling and lenders are still stress-testing, so knowing your number lets you move fast.
- Look at PDOM (total listing days on market), not just LDOM, a home that’s quietly been relisted has a story the “new listing” tag won’t tell you.
Advice for Toronto Sellers
The market is more balanced than the doom headlines suggest, but it is not a seller’s market, and pretending otherwise costs you money. Active listings are down, yes, but a buyer with 4.8 months of inventory to choose from is not in a hurry, and the typical home is taking around 42 days to sell once you count relistings.
Three things that matter right now.
- Price for today, not for 2022, and use the neighbourhood HPI, not your neighbour’s asking price, to set expectations.
- Respect the first two weeks, because if you’re not getting showings and offers in the first fortnight, the price is the problem, not the buyer pool, and the gap between LDOM and PDOM is the market quietly telling sellers exactly that.
- Don’t skimp on presentation, because when buyers have choice, proper photography, professional staging, and honest listing copy are what separate the homes that sell from the ones that sit.
The BREL Bottom Line
May 2026 was a strong sales month that nearly erased the year-to-date gap with 2025. But the engine underneath it is a supply pullback, not a demand surge, and prices are still drifting lower on the measure that matters most. Buyers kept their leverage in May. The condo market kept falling. And “the Toronto market” remained a fiction, because the only thing that’s true on your street is the number for your street.
Our advice hasn’t changed much, and it isn’t changing this month. If you’re a buyer with a pre-approval and a clear plan, this market rewards you. If you’re a seller, you need to price for the buyer who’s reading exactly this data. Nobody gets a fairy tale this spring, but plenty of people are getting good deals, on both sides, by being realistic.