The Toronto Regional Real Estate Board (TRREB) has released their real estate statistics for April 2026, and it’s a weird combination of results we don’t normally see at the same time. Compared to April 2025:
- Sales volume UP +7%
- New listings DOWN 9%
- Sale prices DOWN 4.9%
Under normal conditions, higher sales and lower inventory should lead to higher prices. But in April 2026, prices went down. What happened – and why – is the real story this month.
So, before anyone declares the spring market back, here’s what the TRREB Market Watch actually says.
April 2026 by the Numbers
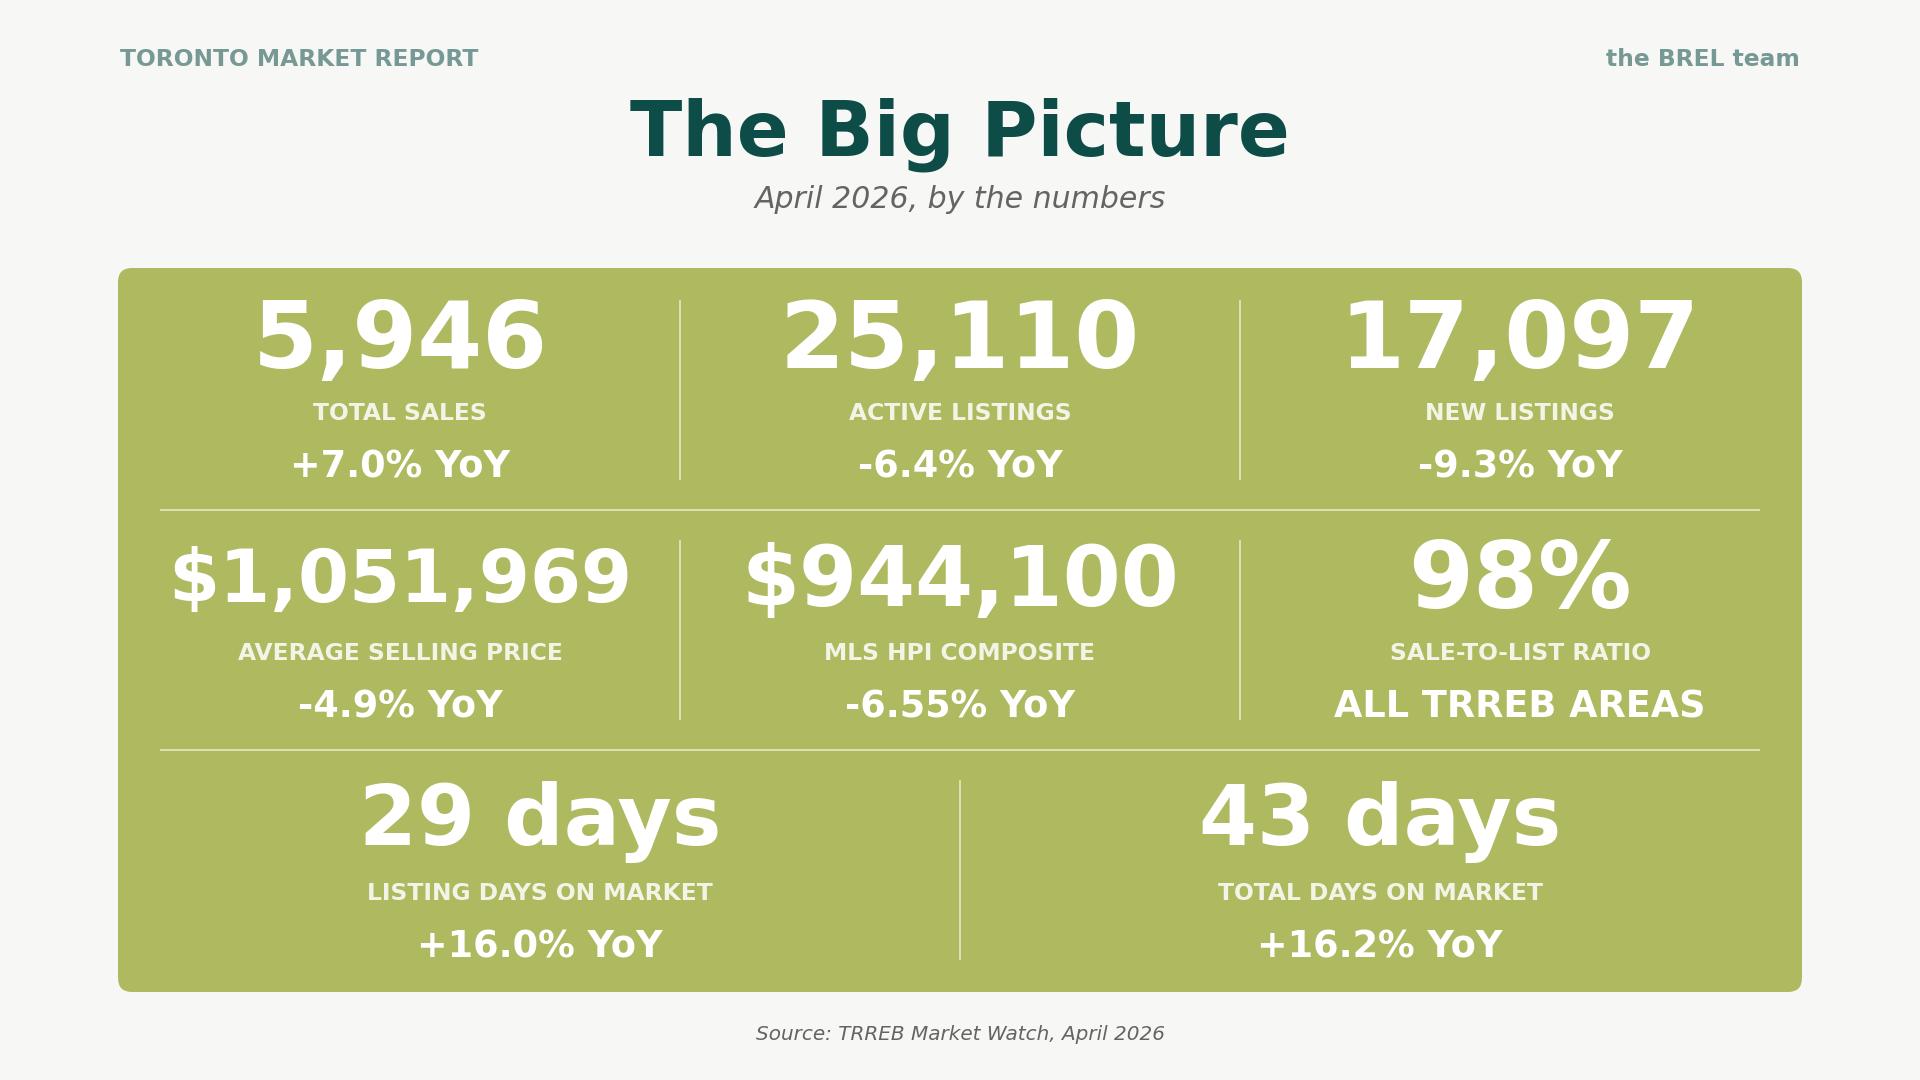
For the first 4 months of this year, 17,862 homes traded across TRREB, about 3% behind the same time period in 2025. April was the catch-up month, not the surge.
Five Things to Know About the April 2026 Stats
1. Sales up, prices down, listings down: a combination that doesn’t usually happen
Tighter inventory plus more buyers normally produces firmer prices, but April 2026 produced softer prices in the GTA:
- Active listings fell 6.4%
- New listings fell 9.3%
- Sales rose 7%
- Average price down almost 5%
The takeaway isn’t just that demand has snapped back. It’s that buyers know they have leverage and they’re using it. Buyers are negotiating from below the list price, not above it.
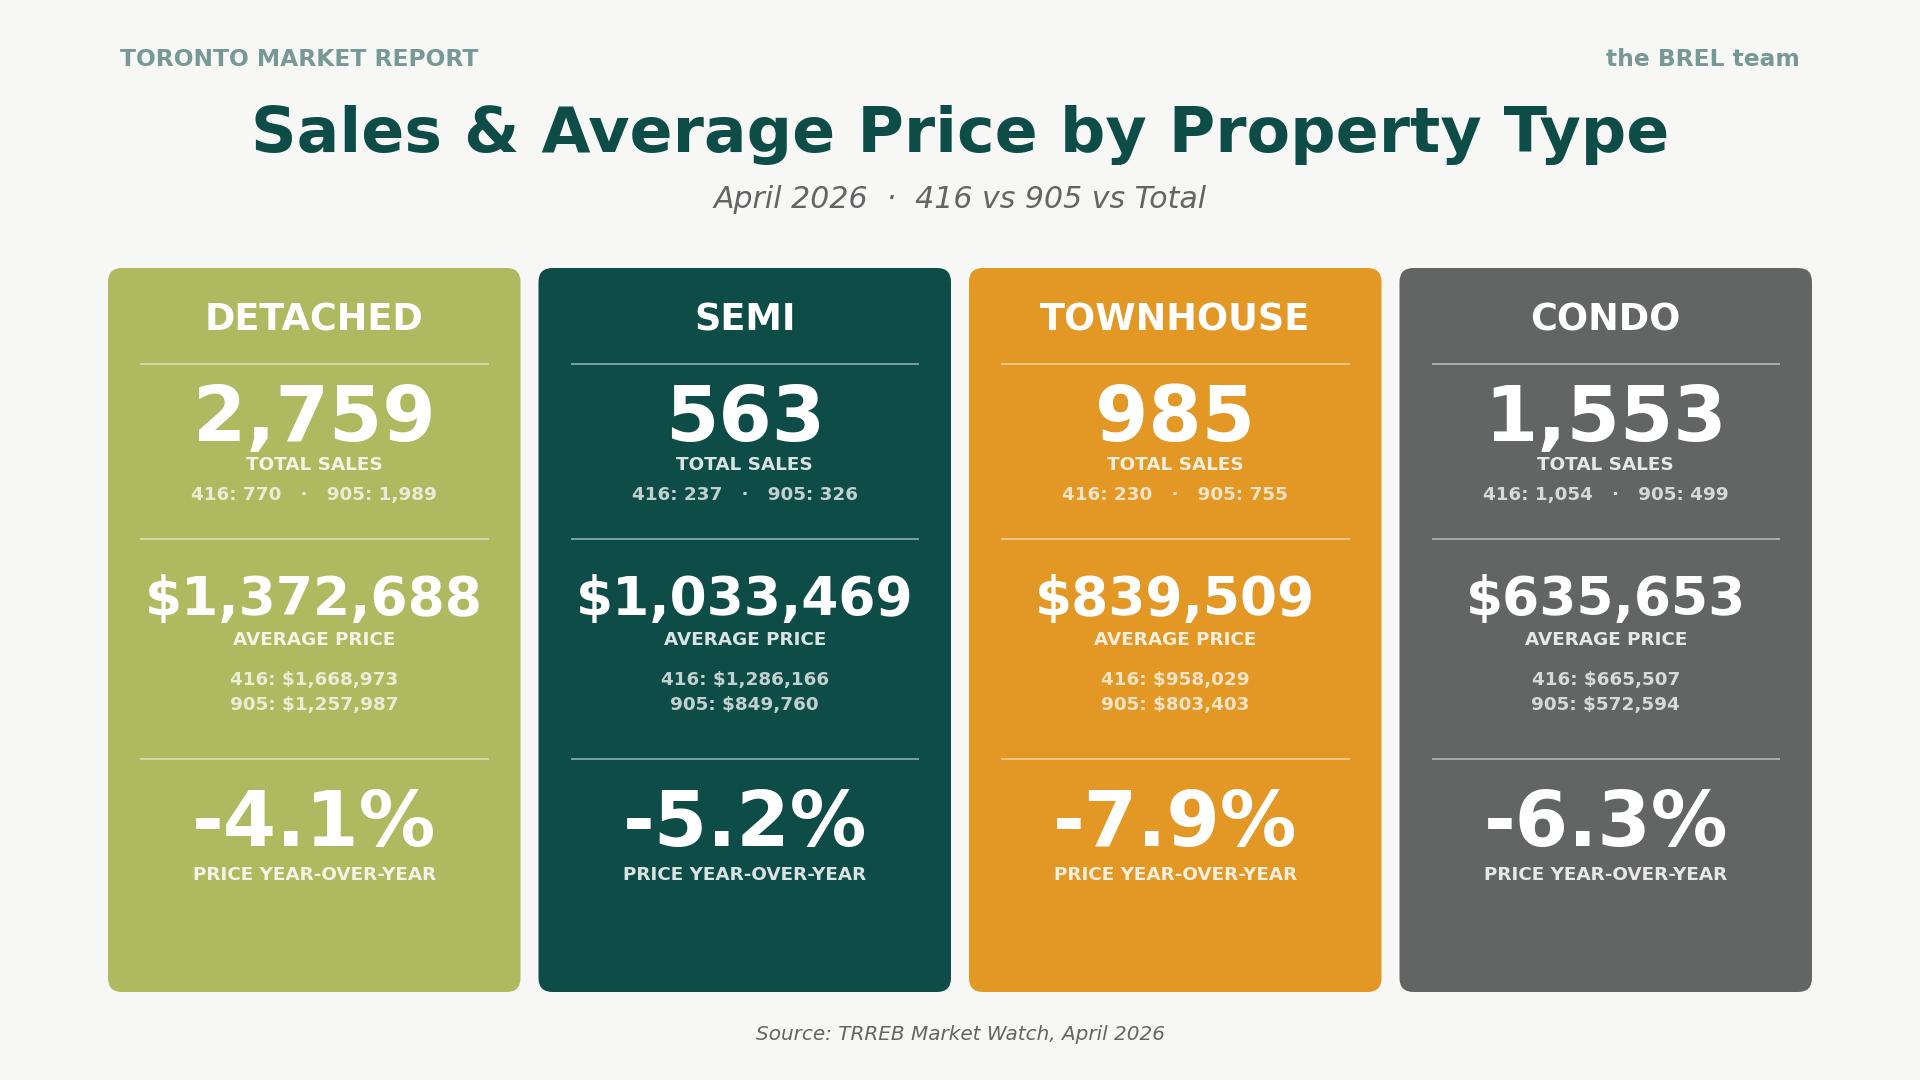
2. The 416 condo market staged a comeback…at a discount
April brought good news for condo sellers, who’ve been impatiently waiting for the first-time buyers to return. Condo sales were up 14.4% in Toronto and 9.1% in the GTA – that’s the strongest sales bounce of any property type.
But April also brought good news for condo buyers, with the average price declining 6.4% to $665,507. Buyers are showing up because the math finally works, and savvy first-time buyers are cautiously returning to the market.
Pro Tip for condo sellers: You NEED to be priced right to sell. Buyers are out there, but if your asking price isn’t supported by current market values, you may be overlooked.
Here’s what happened based on property type:
3. Days on market climbed 16% even as sales rose
It took the average listing 29 days to sell, up from 25 last year. Factor in relists and price changes, and the average property was listed for 43 days (down from 37 days last April). The 14-day gap between the two suggests sellers are still testing prices, seeing nothing happen, and relisting a few weeks later at numbers closer to where the market actually is. The total listing time is the more honest measure of how long it really takes to sell a home, and 43 days for an April number is a reminder that being priced right matters more than hoping this season.
4. The 905 detached market is doing the heavy-lifting
Detached sales in the 905 hit 1,989 in April, up 10.3% year over year, with prices down 5% to $1,257,987. That’s the second-largest year-over-year sales gain of any segment-region combo measured by TRREB (after 416 condos). The pattern across Halton, Peel, York, Durham, and Simcoe is the same: more transactions, lower prices. It looks like the buyers who were pushed out of detached homes during the 2021-2022 buying frenzy are coming back, taking advantage of average prices that, in places like Caledon and Aurora, are down 10-13%.
5. Three demand levers are quietly loaded
Three important things happened in April to help boost buyer demand:
- The Bank of Canada held the overnight rate at 2.25% in April, the fourth consecutive hold.
- The provincial and federal governments are removing the full 13 per cent of the Harmonized Sales Tax (HST) for eligible buyers of new homes in their next budget. That’s a rebate of up to $130,000 on a million-dollar house. See the full rebate details here.
- There’s a federal/provincial plan to reduce municipal development charges by up to 50% for 3 years.
Of course, none of these changes have shown up in resale prices yet – they’re aimed at new construction, and resale buyers are still focused on what’s already on the MLS. But the demand-side conditions are stacking in a way they haven’t in years. The lag is real, the policy stack is real, and at some point, the two collide.
Neighbourhood Prices: What the HPI Data Tells Us
Quick refresher on why we use HPI data and not average prices for neighbourhood comparisons:
- The average price shows what was sold this month, full stop. If three $4M Forest Hill homes sold and 30 little condos didn’t, the average will spike, and it’ll have nothing to do with whether prices actually moved.
- The MLS Home Price Index strips out that mix-shift noise. It’s a benchmark for a “typical” home in the area, tracked over time. For comparing how a neighbourhood is moving, HPI is the cleaner signal.
Scroll through the galleries below to see the neighbourhood stats:
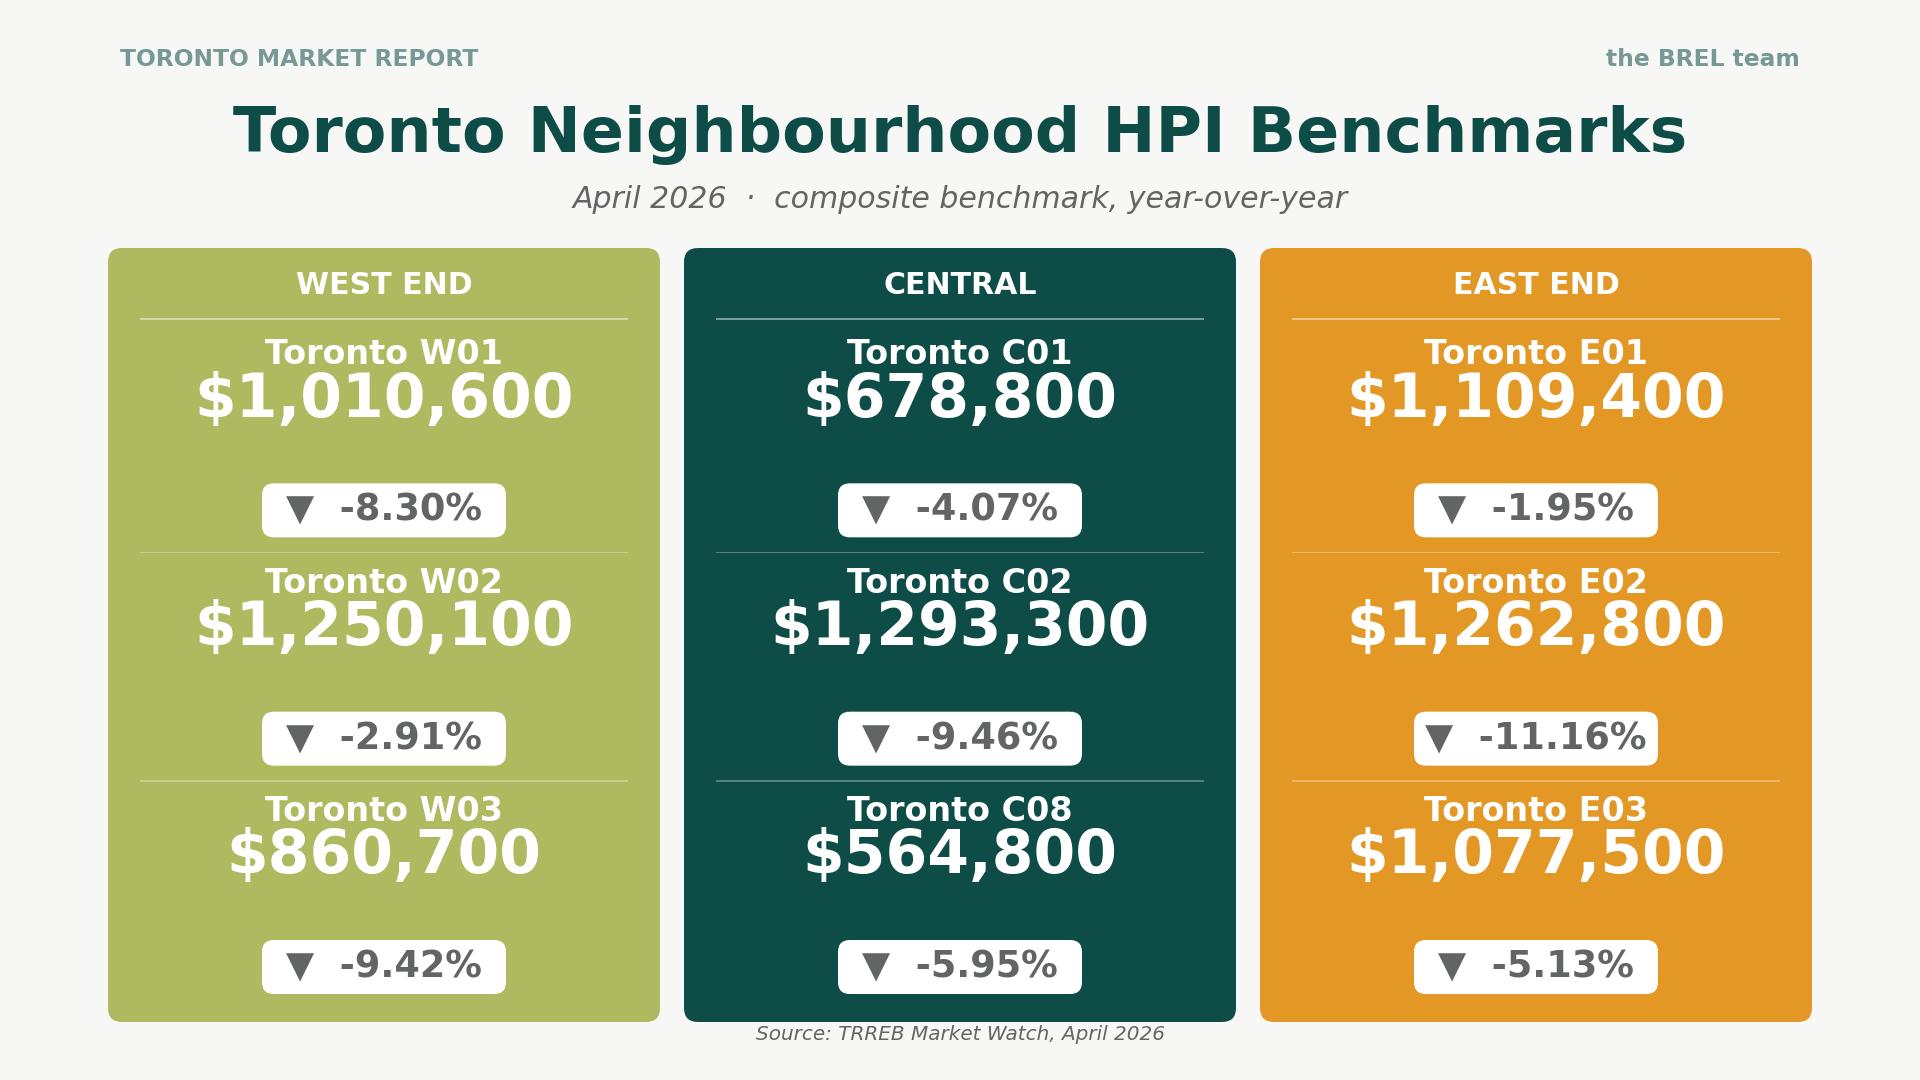
Central Toronto
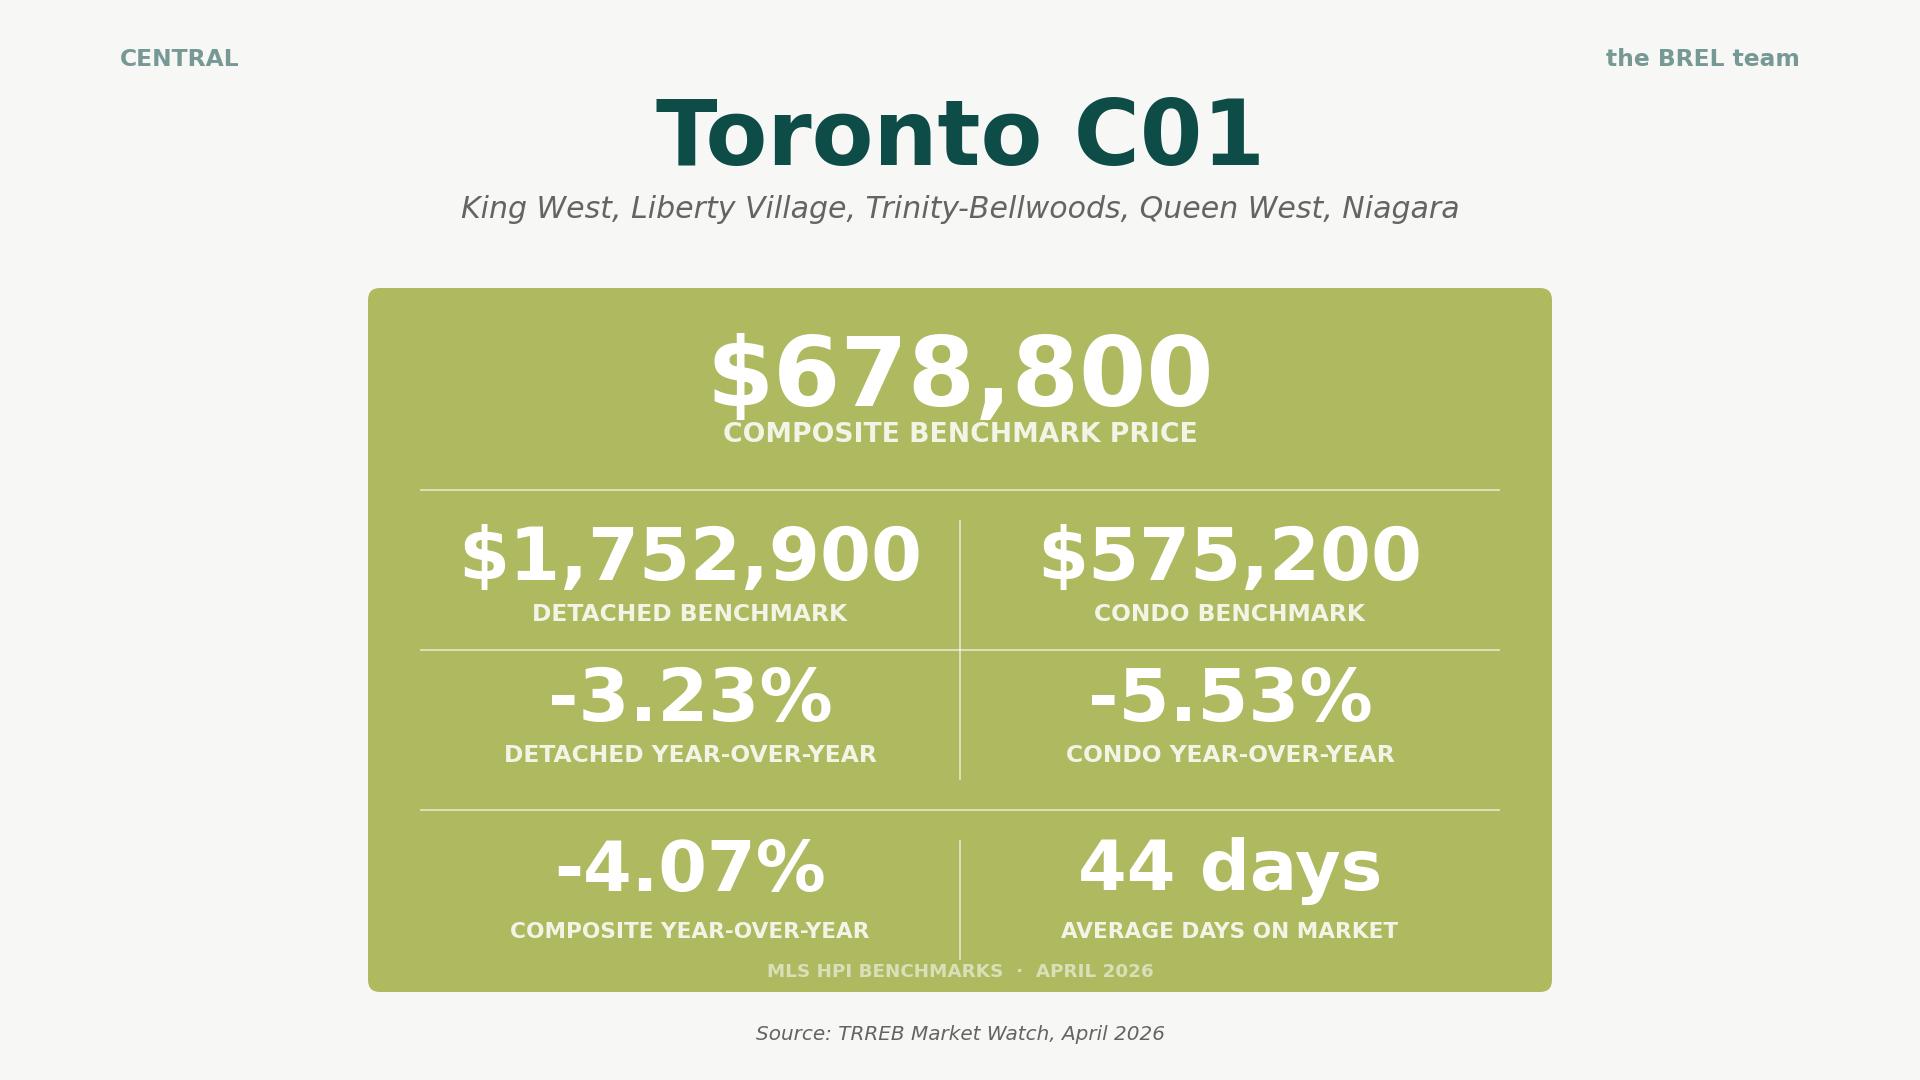
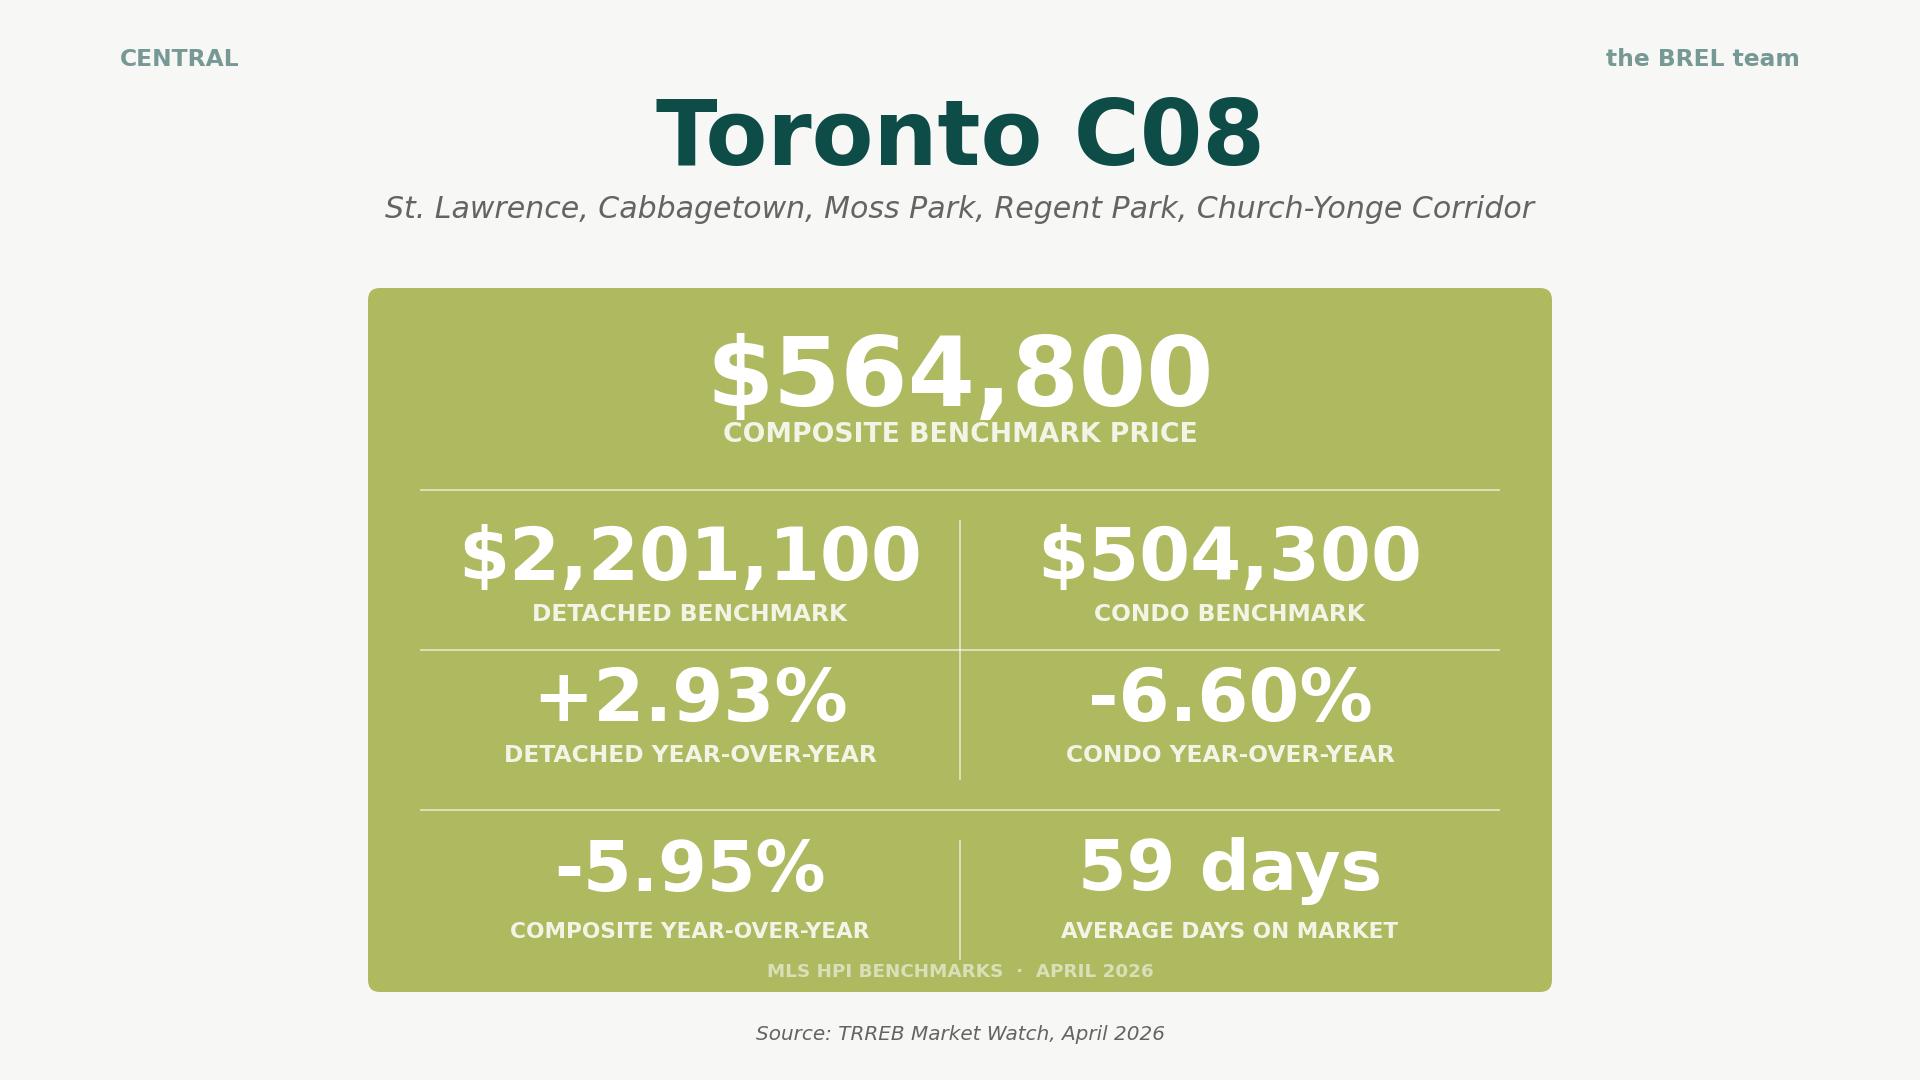
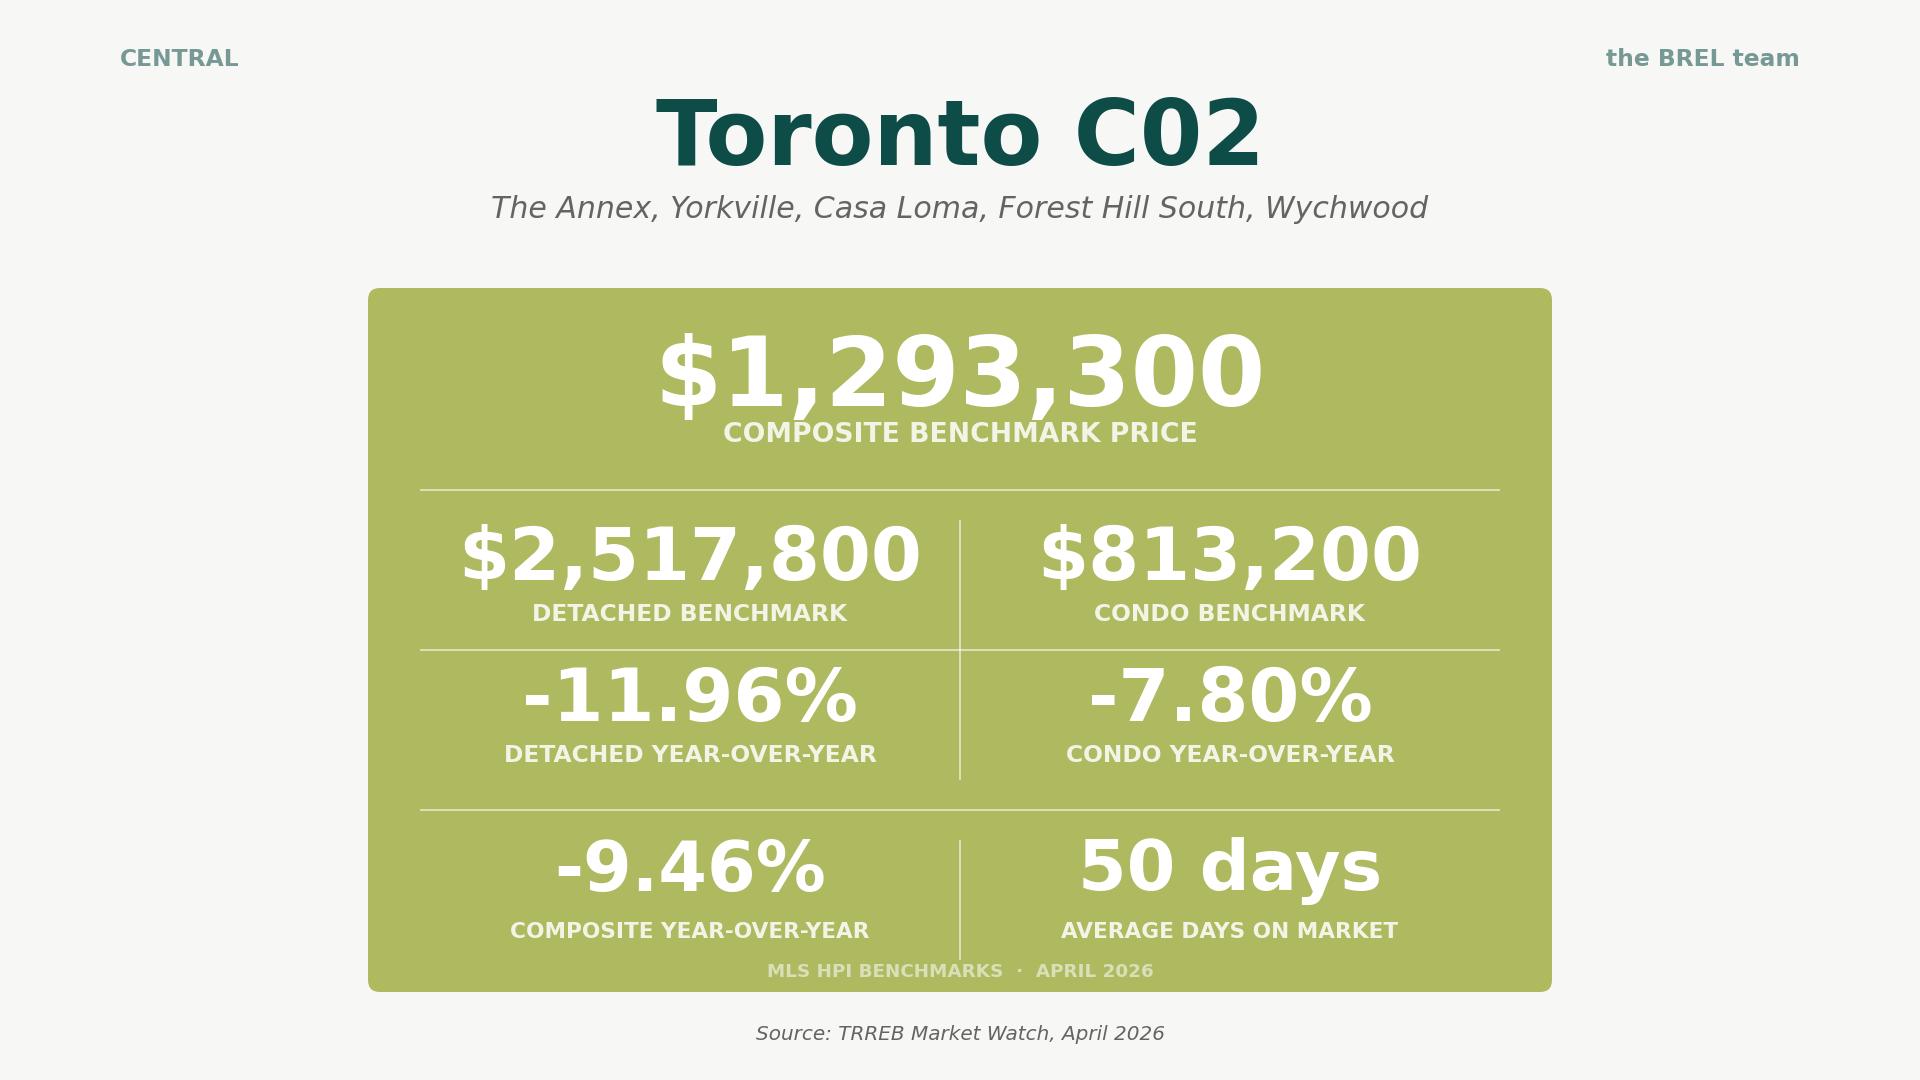
Takeaway: C02 is the deepest correction in the city core, with detached benchmarks down nearly 12%. The condo-heavy C01 is softer than the broader market but more stable than C02. C08’s tiny detached pool ticked up on a thin sample (treat with appropriate skepticism). For buyers, central Toronto is where the percentage discounts are biggest. For sellers, this is where unrealistic pricing dies fastest.
West End
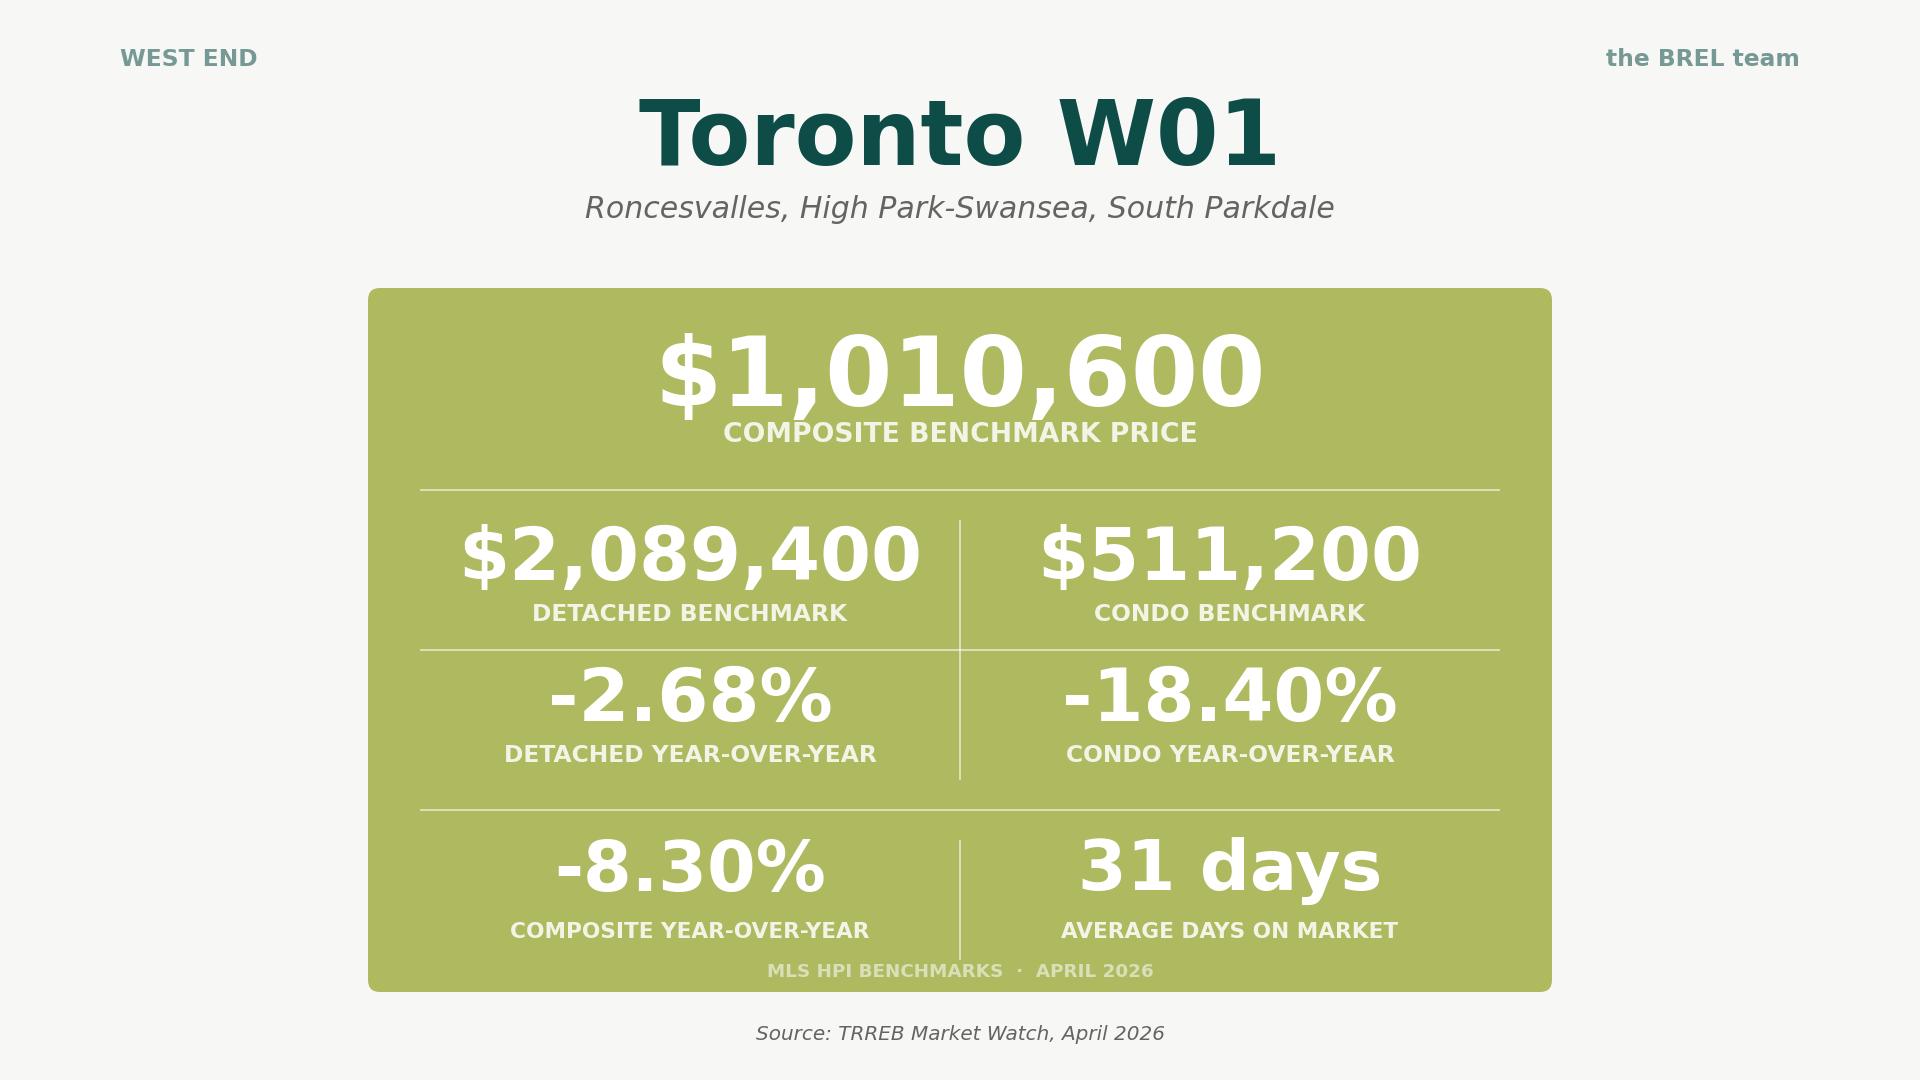
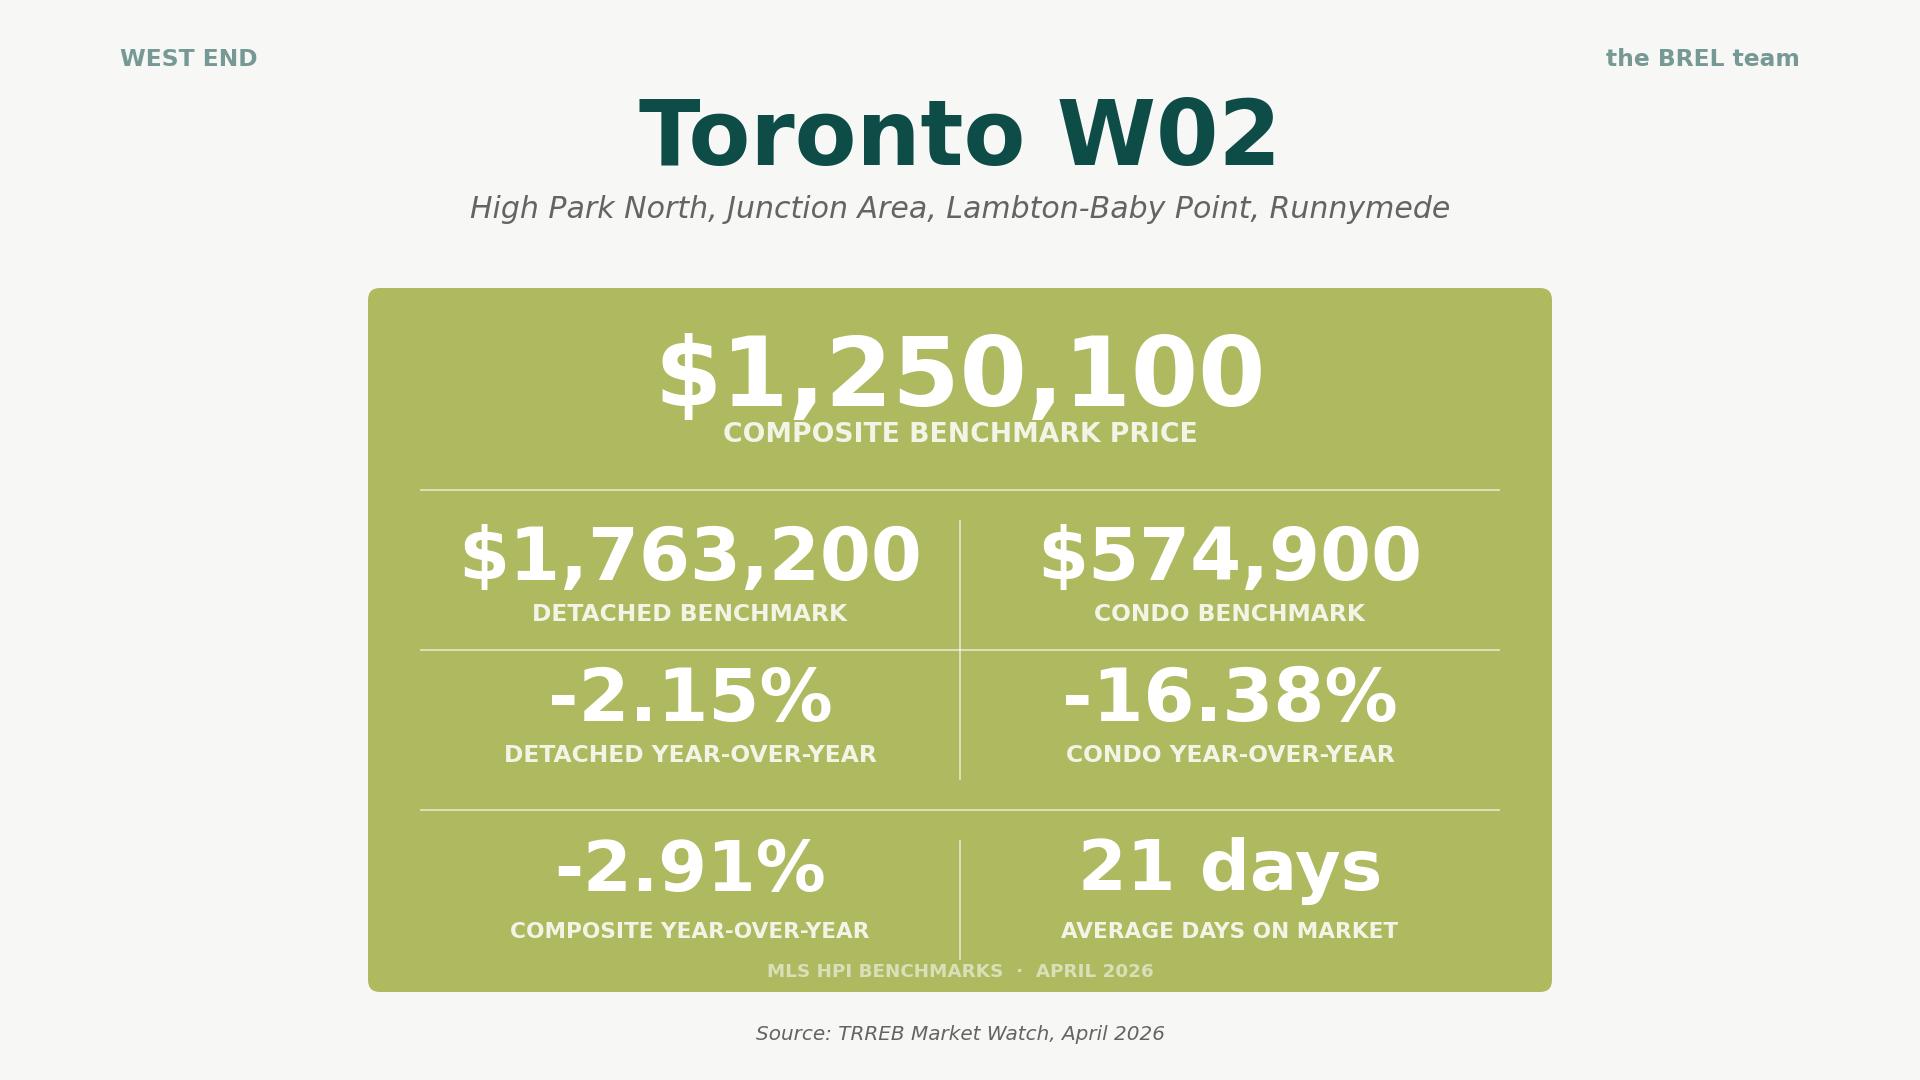
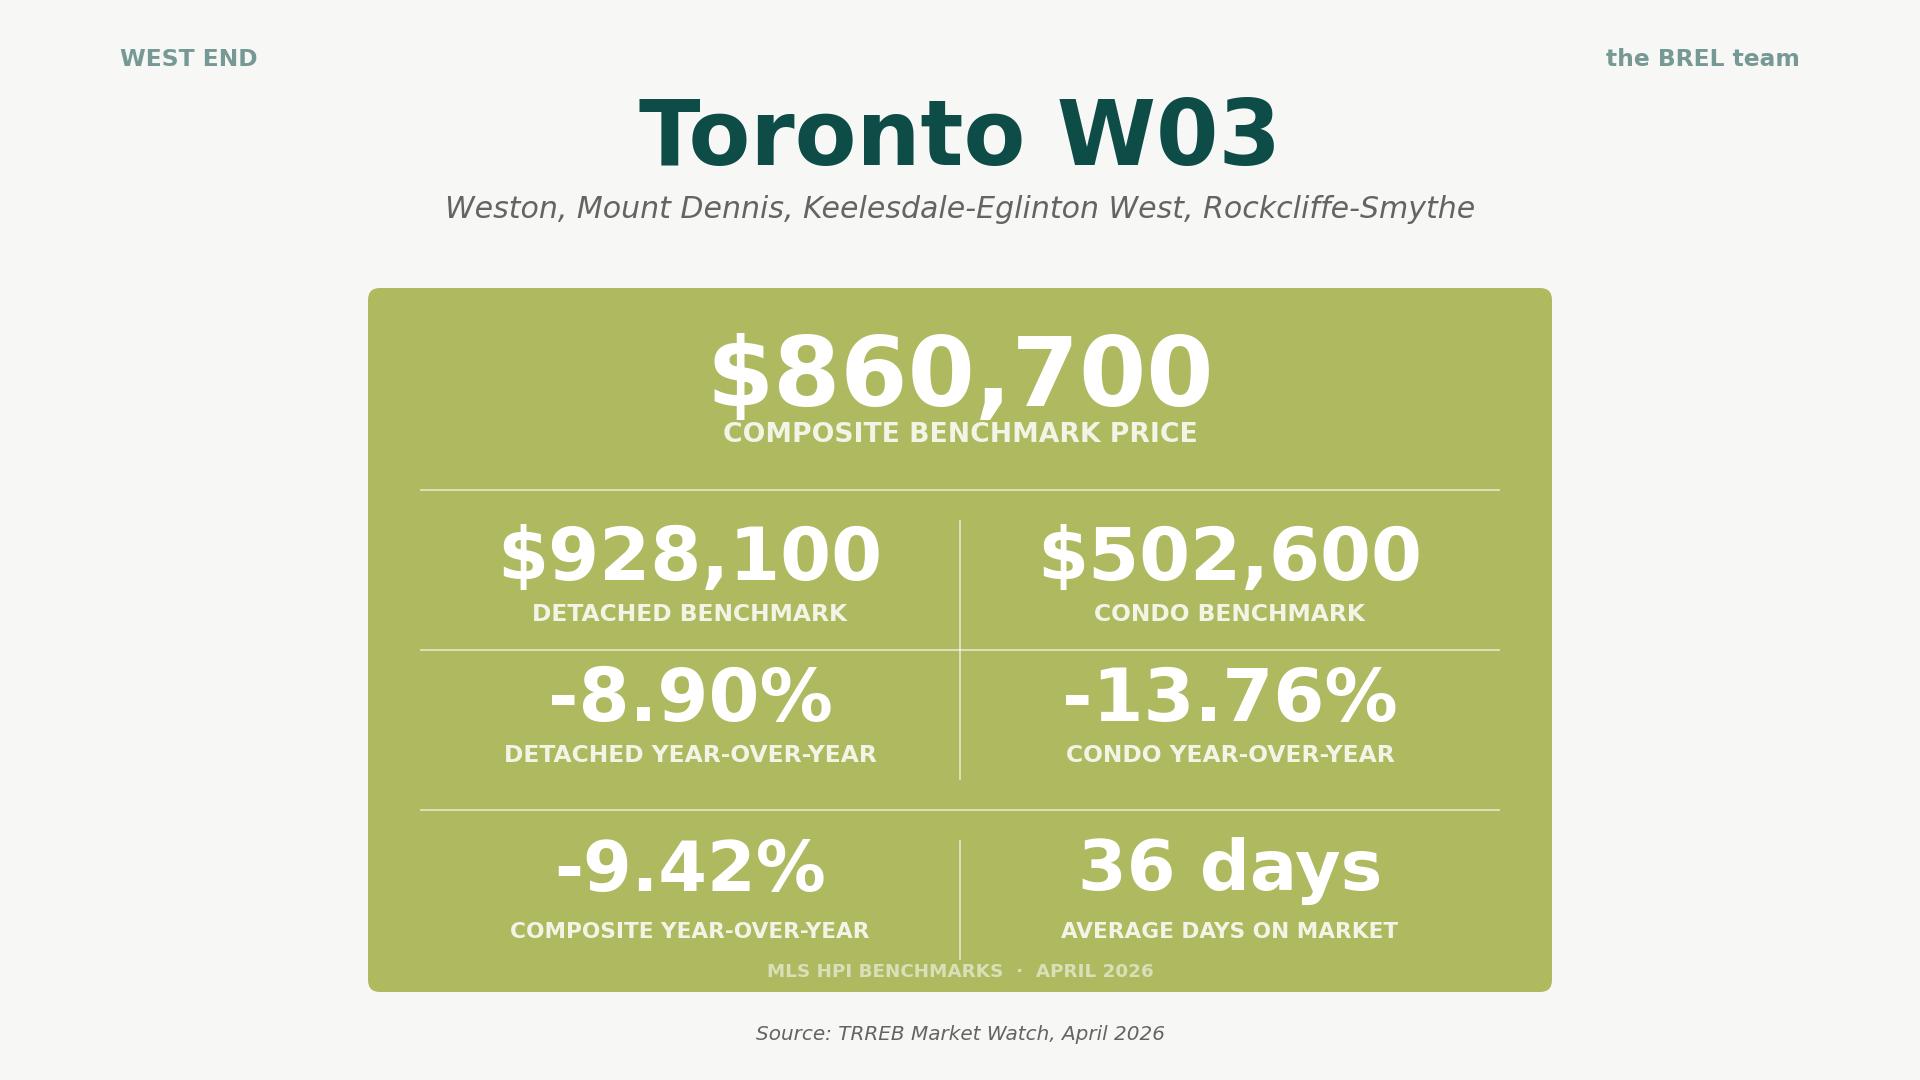
Takeaway: The detached numbers in W01 and W02 are holding up reasonably well (down 2-3%), but the condo market is suffering. Drops of 13% to 18% on the condo benchmark in three of Toronto’s most desirable west-end pockets is a window for a buyer who’s been priced out of these neighbourhoods. W03 is softer across the board, reflecting the broader market drift in less-pressured pockets.
East Toronto
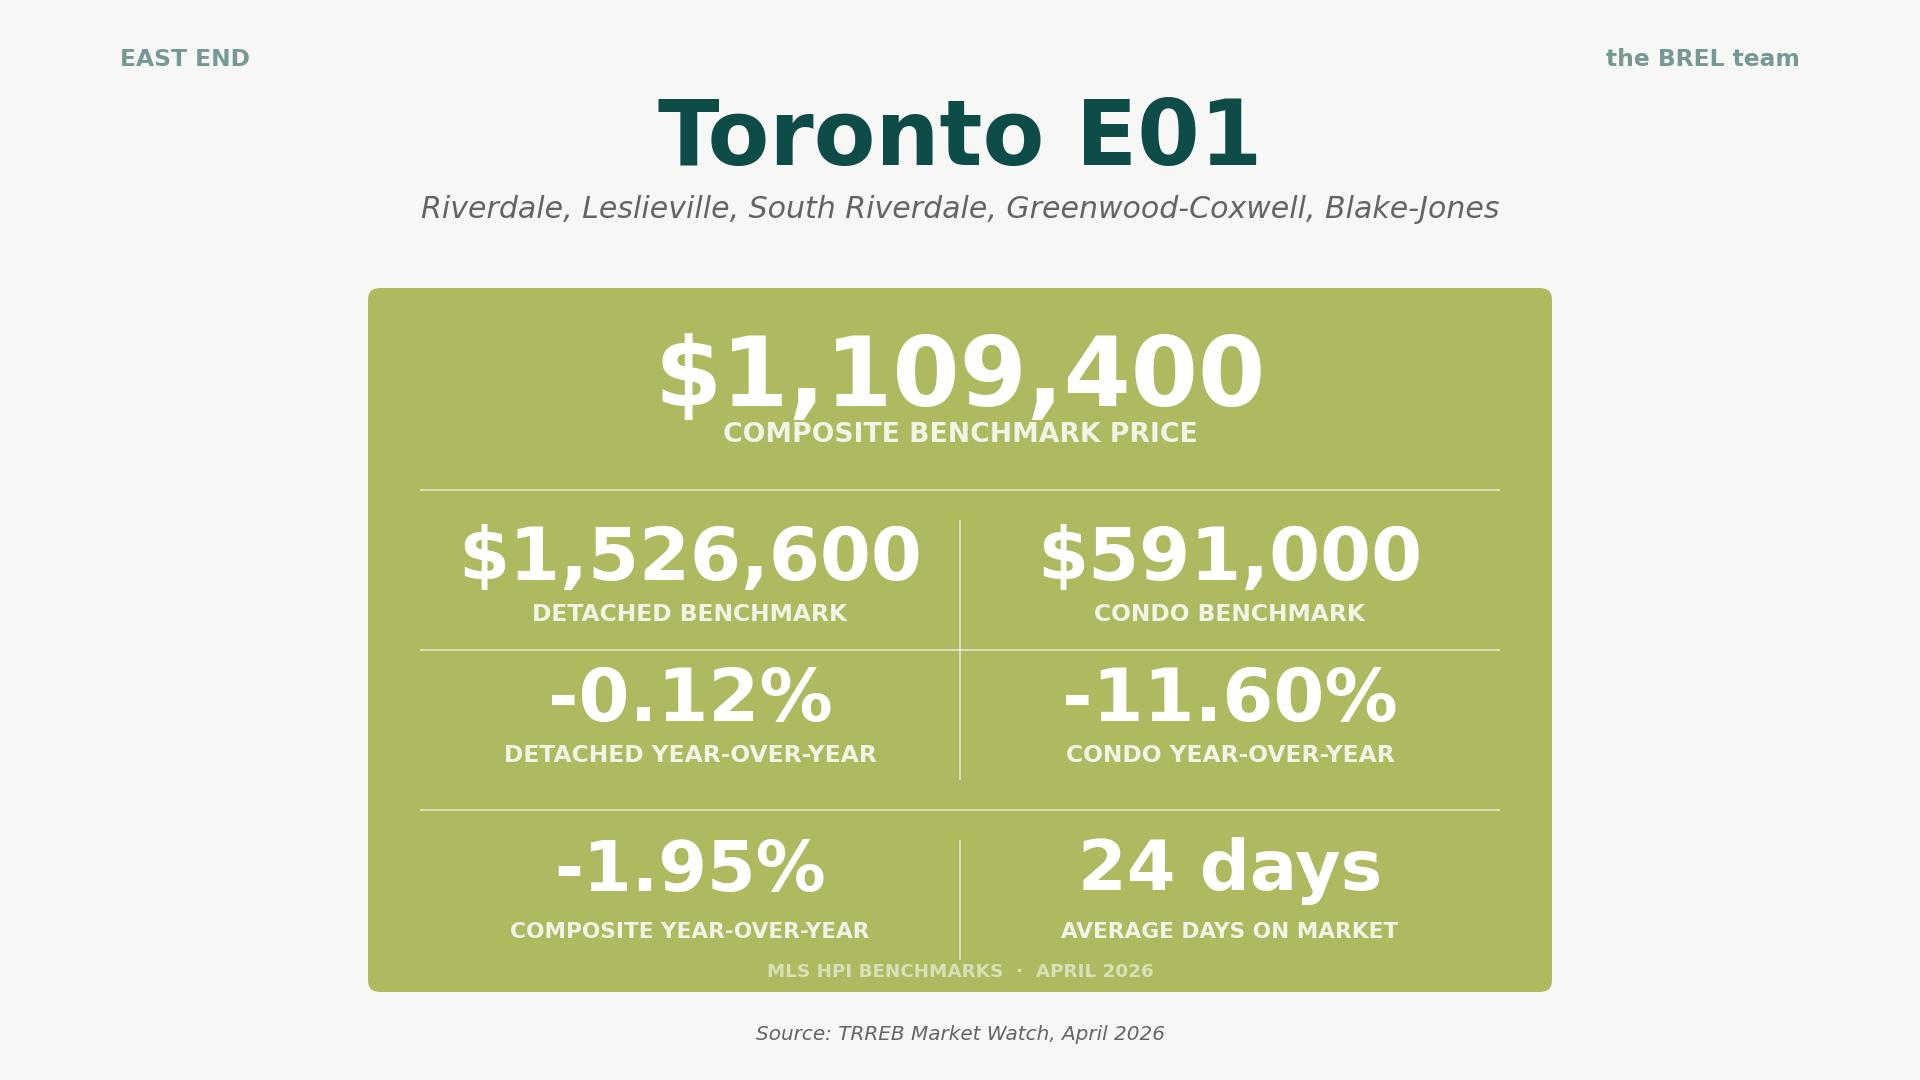
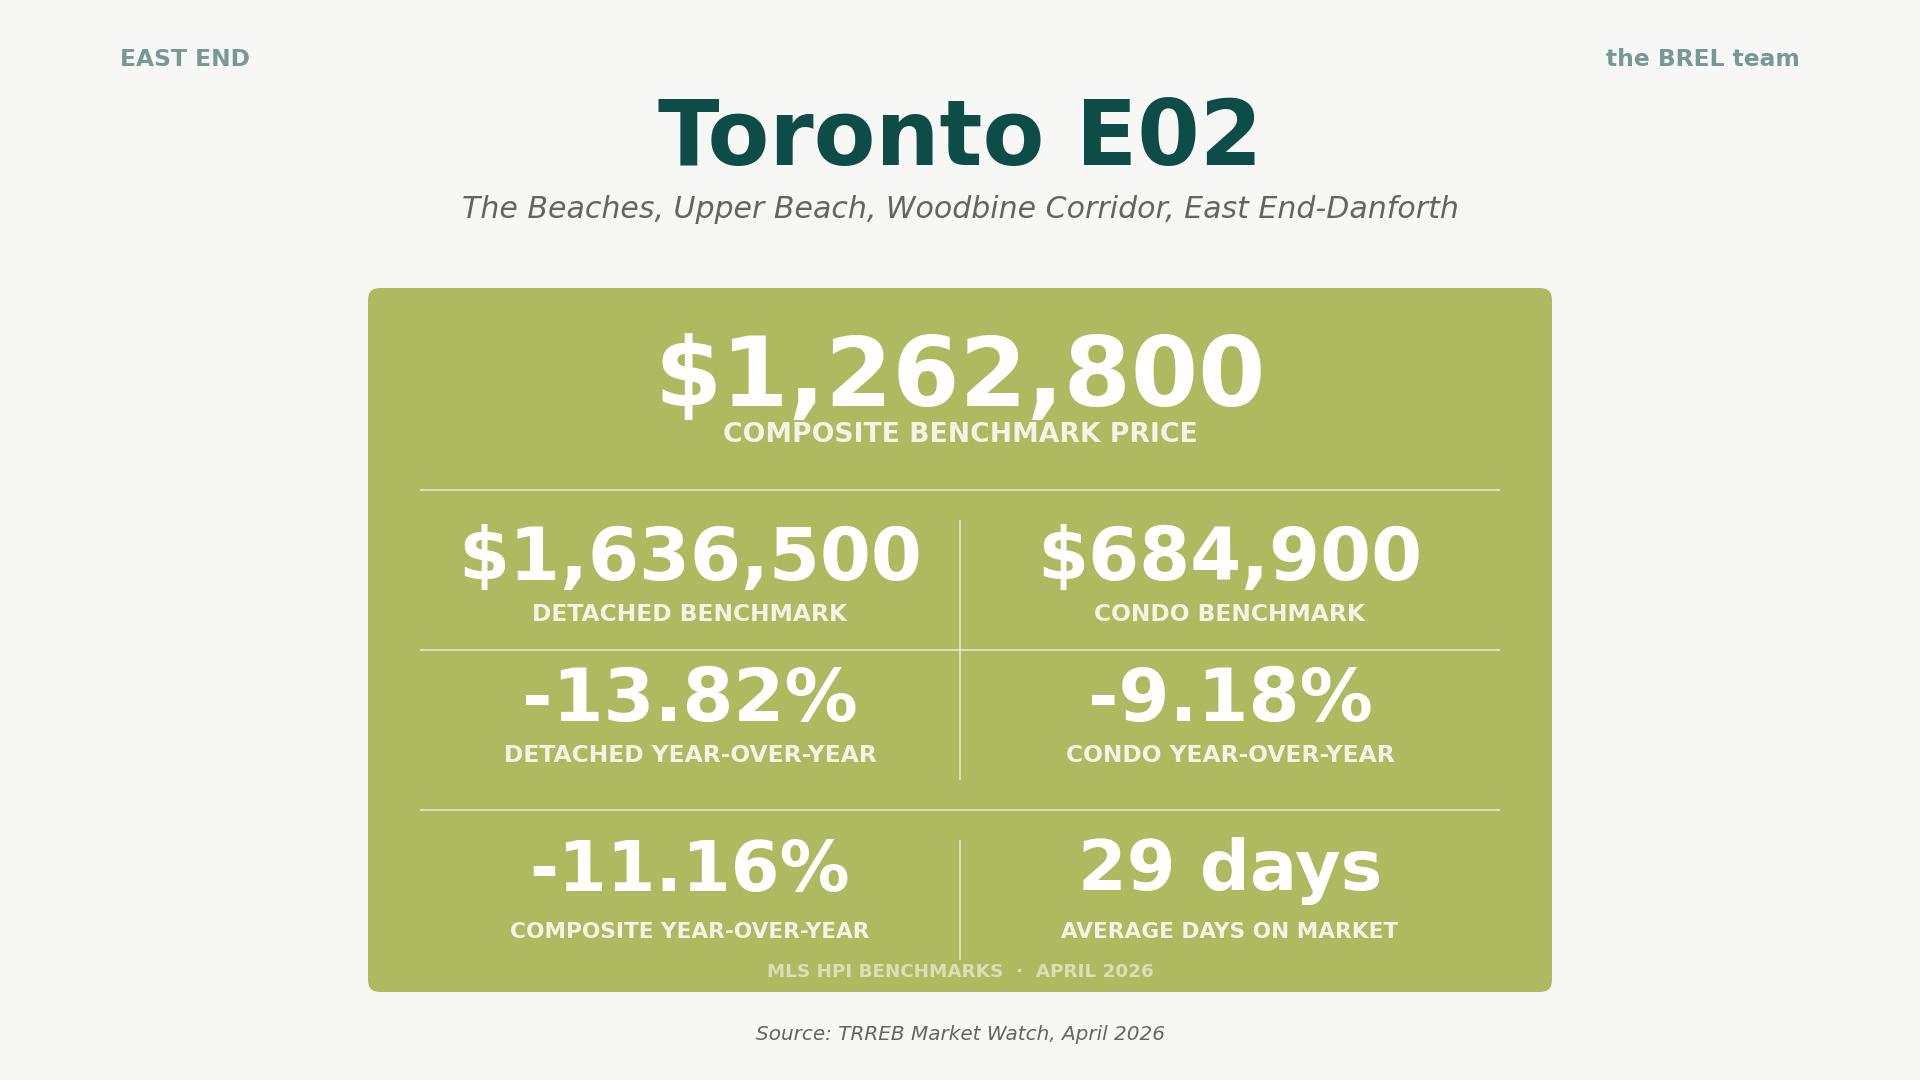
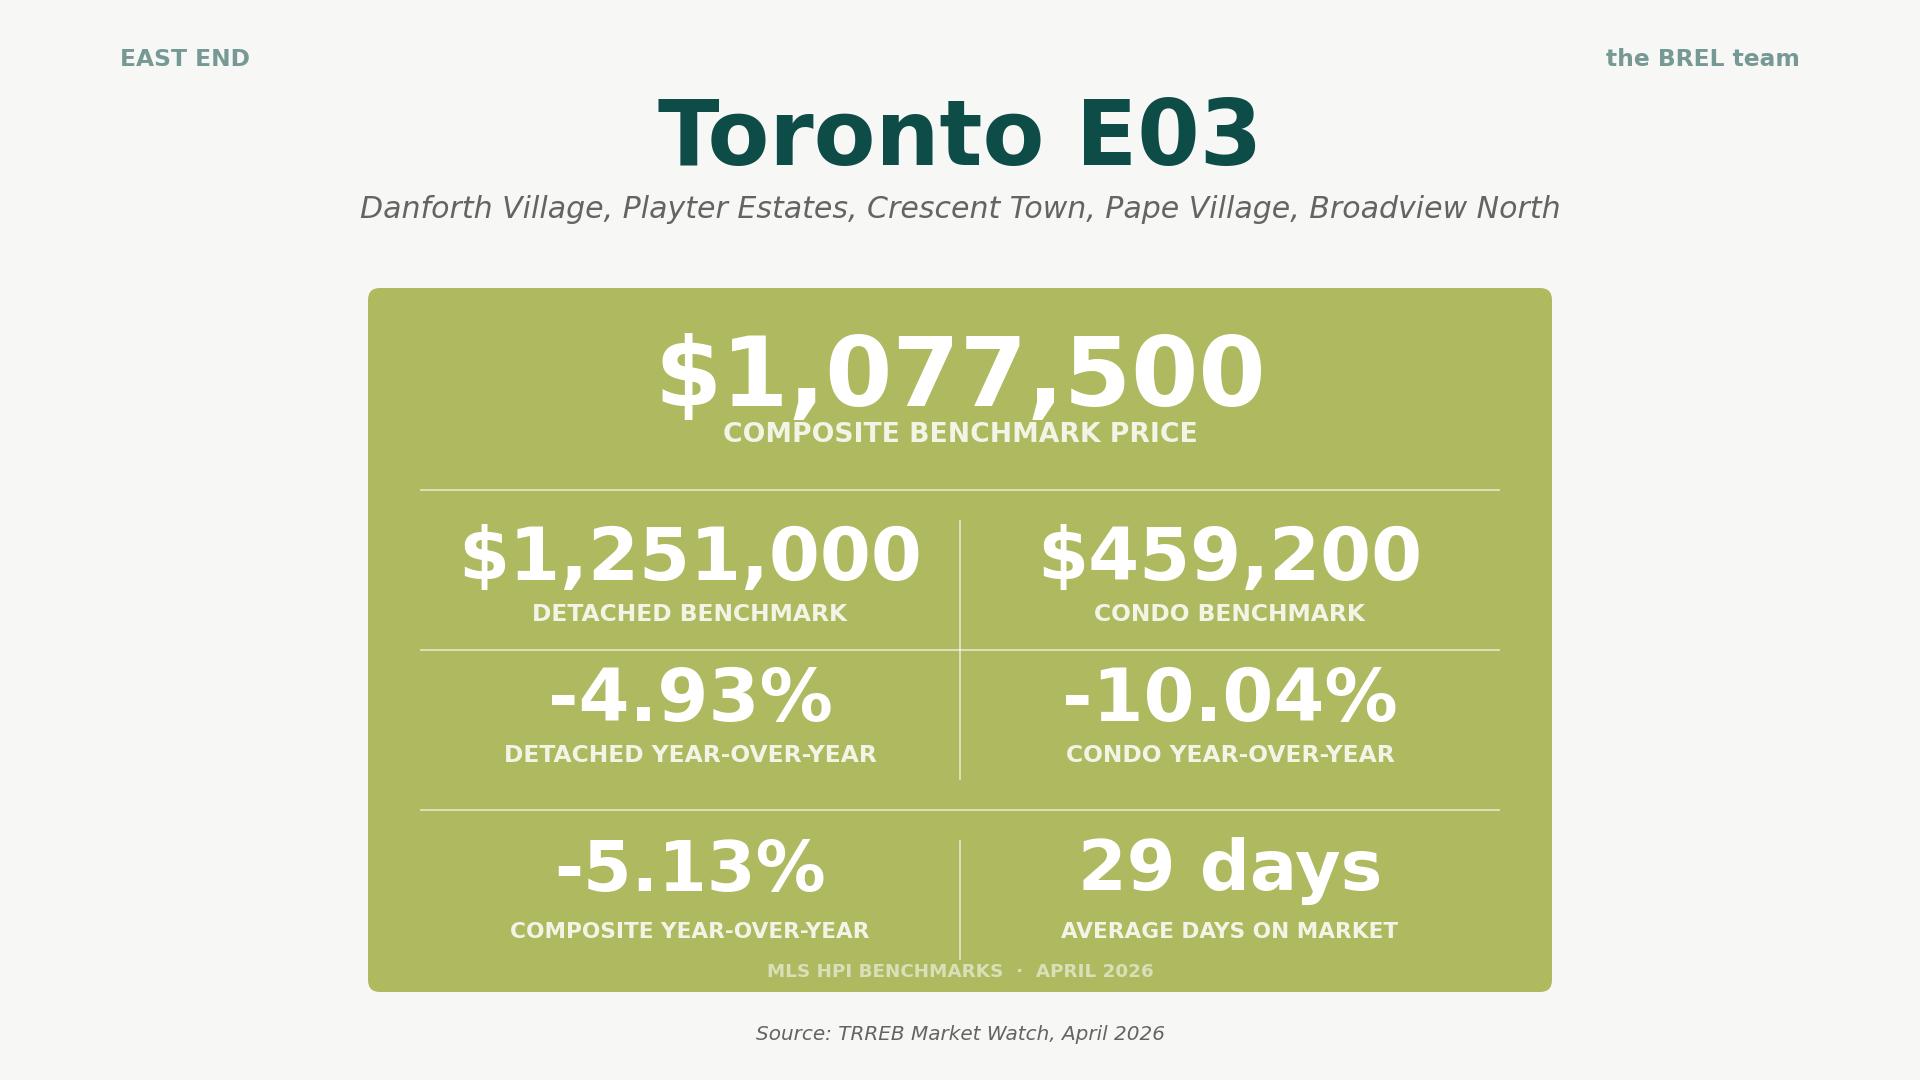
Takeaway: E01’s detached benchmark is essentially flat. That is the most resilient detached pocket in our nine-neighbourhood scan, and a reminder that east-end buyers continue to like the package: walkable, schools, transit, character homes. E02 is the outlier in the other direction, with detached down nearly 14%, which is the kind of move that creates real opportunity. E03 sits in the middle.
News Roundup: April 2026
Here’s a roundup of the real estate-related news from April 2026:
Bank of Canada holds at 2.25% for a fourth time
The April 29 decision left the overnight rate unchanged, with the Bank citing inflation slightly above target (2.4%), volatile financial conditions, and softening labour markets. Prime stays at 4.45%. Variable-rate borrowers won’t see payment changes, but the message is “neither cut nor hike,” which is its own kind of stability after years of moves.
$8.8 billion federal-Ontario deal slashes development charges
Prime Minister Carney and Premier Ford announced a partnership that will cut municipal development charges by up to 50% across municipalities representing 80% of Ontario’s population, for three years. The intent is to reduce the cost of building new homes by tens of thousands of dollars per unit.
First-Time Home Buyer GST Rebate now law
Bill C-4 received Royal Assent on March 12, 2026. The new federal rebate eliminates GST on qualifying new builds priced up to $1 million for eligible first-time buyers (maximum saving $50,000), with a phase-out to $1.5 million. Combined with Ontario’s enhanced HST relief, eligible first-time buyers of new homes up to $1.5M could see up to $130,000 in combined federal-provincial relief. The agreement of purchase and sale must be dated on or after March 20, 2025 and before 2031.
GTA rental vacancies up, asking rents down
Urbanation’s Q1 2026 data put vacancy in post-2000 rent-stabilized buildings at 5.4%, up from 3.6% a year earlier. Newer luxury condo-rental segments are seeing vacancies above 6%. Asking rents are down roughly 7% YoY for one-bedrooms and 9% for two-bedrooms. Two-thirds of rental projects are offering incentives. For investors, the rental math is not what it was. For tenants, it’s the best leverage they’ve had in a decade.
Tariffs pushing up new-build costs
US tariffs on lumber, gypsum, steel, and cabinetry are adding an estimated $9,000 to $11,000 to the cost of building a new home, per the Canadian Home Builders’ Association and NAHB analyses. New supply was already constrained. Tariffs make it more expensive to add to it.
CMHC Spring 2026 outlook: GTA prices forecast lower for 2026
CMHC projects the GTA aggregate Q4 2026 home price at $1,054,129, down 4.5% YoY. Detached -1.0% to $1,382,832. Condos -6.5% to $615,885. The agency also flagged that for the first time this century, City of Toronto rental starts exceeded condo starts.
Advice for Toronto Buyers
If you’ve been waiting for proof that prices have come down, the data has been giving you that proof for months. But prices that are “lower than last year” doesn’t mean “still falling fast.” The month-over-month picture is flat to slightly up on a seasonally adjusted basis. The price drift may be levelling, especially in areas where buyers are already showing up.
Three practical things to do this spring:
- Run the math on the new GST rebate if you’re a first-time buyer looking at new construction. Up to $50,000 off federal GST is not nothing, and the Ontario layer can stack on top.
- Pre-approval is more important than usual. The mortgage market is steady and lenders are still rate-stress-testing. Knowing your number means you can move fast on the right listing without scrambling.
- Hire a REALTOR. While browsing realtor.ca and going to open houses is part of the home buying process, an experienced REALTOR will be invaluable in your home search and purchase. Read our First-time Buyer Guide here.
Advice for Toronto Sellers
The market is more balanced than the headlines suggest, but it isn’t a seller’s market. Active listings are down, but there are still 25,110, homes for sale in the Greater Toronto Area and they are taking 43 days on average to sell.
Three things that matter right now:
- Price for today, not for 2022. The neighbourhood data is your friend. Look at what comparable homes have actually sold for in the last 60 days, not what they listed for. Every cluster in this report shows benchmarks materially below their 2024 peaks.
- The first two weeks matter most. If your home isn’t getting traffic and offers in the first 14 days, the price might be the issue, not the buyer pool.
- Presentation still pays. With buyers having choice, the listings that stand out are the ones with great photography, staging and marketing beyond the MLS. The basics still beat the gimmicks.
The BREL Bottom Line
The stats are one thing…but what are we seeing on the ground?
We’re busy. Really busy. More than one BREL agent has commented that they “haven’t been this busy since 2021” and our (very tired) staging team staged/destaged a record number of homes in April -thank you Kiel, Enoch and Jim!
Our listings saw a significant increase in online traffic and showings across all property types (yep, condos too!) and faster sales. Our open houses were busy, we hosted some very competitive bidding wars and even had a couple of bully offers. It was a great month for BREL.
Our advice hasn’t changed for a few months, and it isn’t changing this month either. If you’re a buyer with a pre-approval and a clear plan, you’re in a market that rewards you. If you’re a seller, you need to price for the buyer who’s reading the data. Neither side gets a fairy tale this spring