
The official word on real estate in Toronto in July 2026 is that market conditions “tightened.” The numbers technically support that, but how it tightened matters.
Sales fell 0.9% compared to last July, while new listings dropped 17.8%. When supply falls faster than demand, the ratios that measure “tightness” improve even if buyers haven’t rushed back into the market. In July, we saw sellers leaving the market in droves.
We are currently experiencing a balanced market, one that leans in buyers’ favour.
- There are 4.6 months of inventory, meaning it would take that long to sell all the properties currently listed for sale, at the current sales pace. 4-6 months of inventory is considered a balanced market.
- The average home sold for 97% of asking and took 45 days to sell once you count relistings.
- The average selling price came in at $1,003,956, down 4.5% year over year, and the MLS HPI Composite is down 4.6%.
So while prices haven’t improved, the supply side of the market is shrinking, and that’s the trend worth watching heading into fall.
Let’s dig in.
The Big Picture: July 2026 by the Numbers
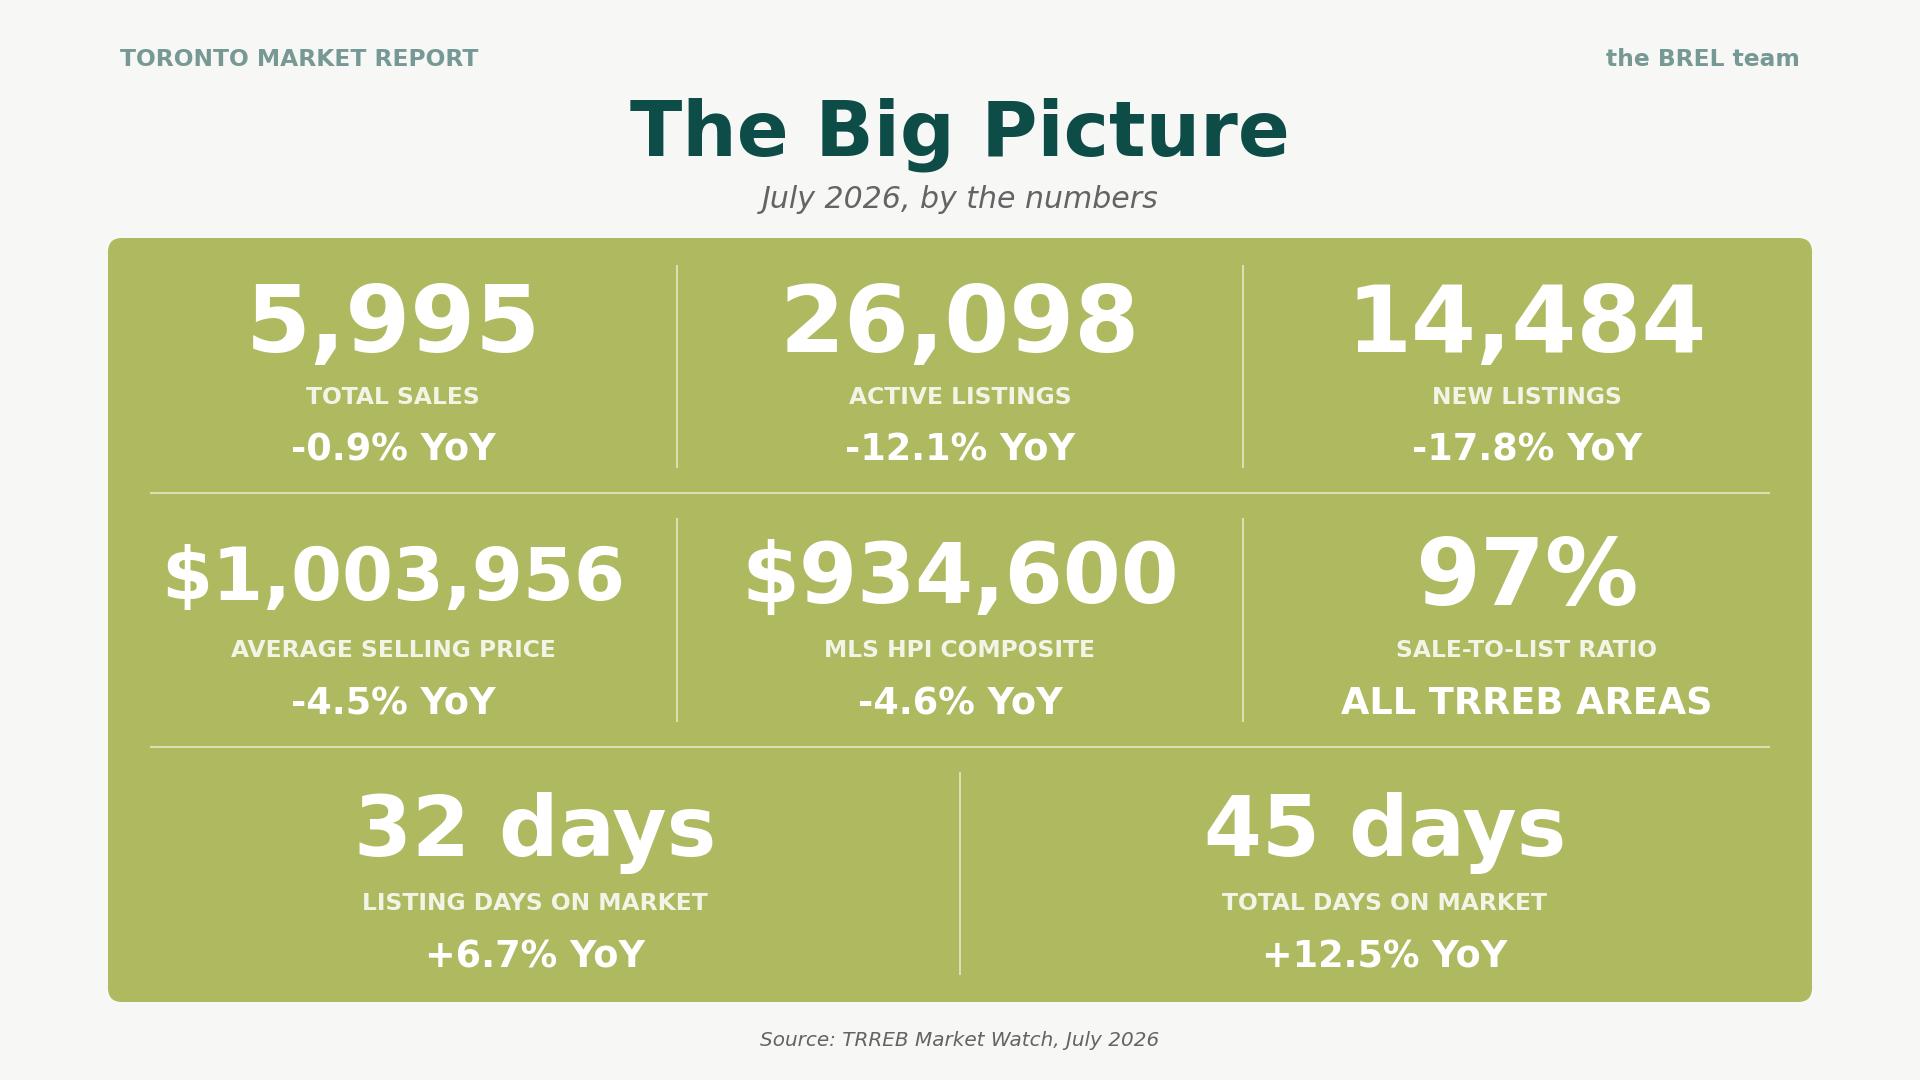
Seven months in, 37,105 homes have traded across TRREB at an average of $1,032,207. On a seasonally adjusted basis, July sales were actually up from June while new listings fell again, so the supply-demand gap has been narrowing all summer.
Five Things to Know About the July 2026 Stats
1. Toronto’s sellers are on strike
The single biggest force in the July data isn’t buyers. It’s the sellers who didn’t show up. New listings fell 17.8% year over year, and active listings dropped 12.1%, while sales went essentially nowhere, down 0.9%. We call this a seller strike: homeowners who would normally list are sitting on their hands, unwilling to accept today’s prices, waiting for a market they like better. The pattern has been building all year in the listings data, and July was its strongest month yet.
Why it matters: a seller strike makes the market seem “tighter,” because sales now account for a bigger share of the listings, without any actual growth in demand. That kind of tightening is real, and it does reduce buyers’ options. It’s also fragile. It depends on sellers continuing to hold out, and strikes end. If listings return in force after Labour Day, this tightness will disappear as fast as it appeared.
2. The scariest number in the report is mostly seasonal
The average selling price fell to $1,003,956, the lowest monthly average since January and roughly $66,000 below May’s peak. But it’s important to remember that July is always a soft month (last year’s average also sagged from June to July). The HPI Composite (used to seasonally adjust the stats) shows the year-over-year decline in prices fell from 5.4% in June to 4.6% in July, so we’re heading in the right direction.
3. The 416 is outperforming the 905
We continue to see different markets in the 416 vs the 905:
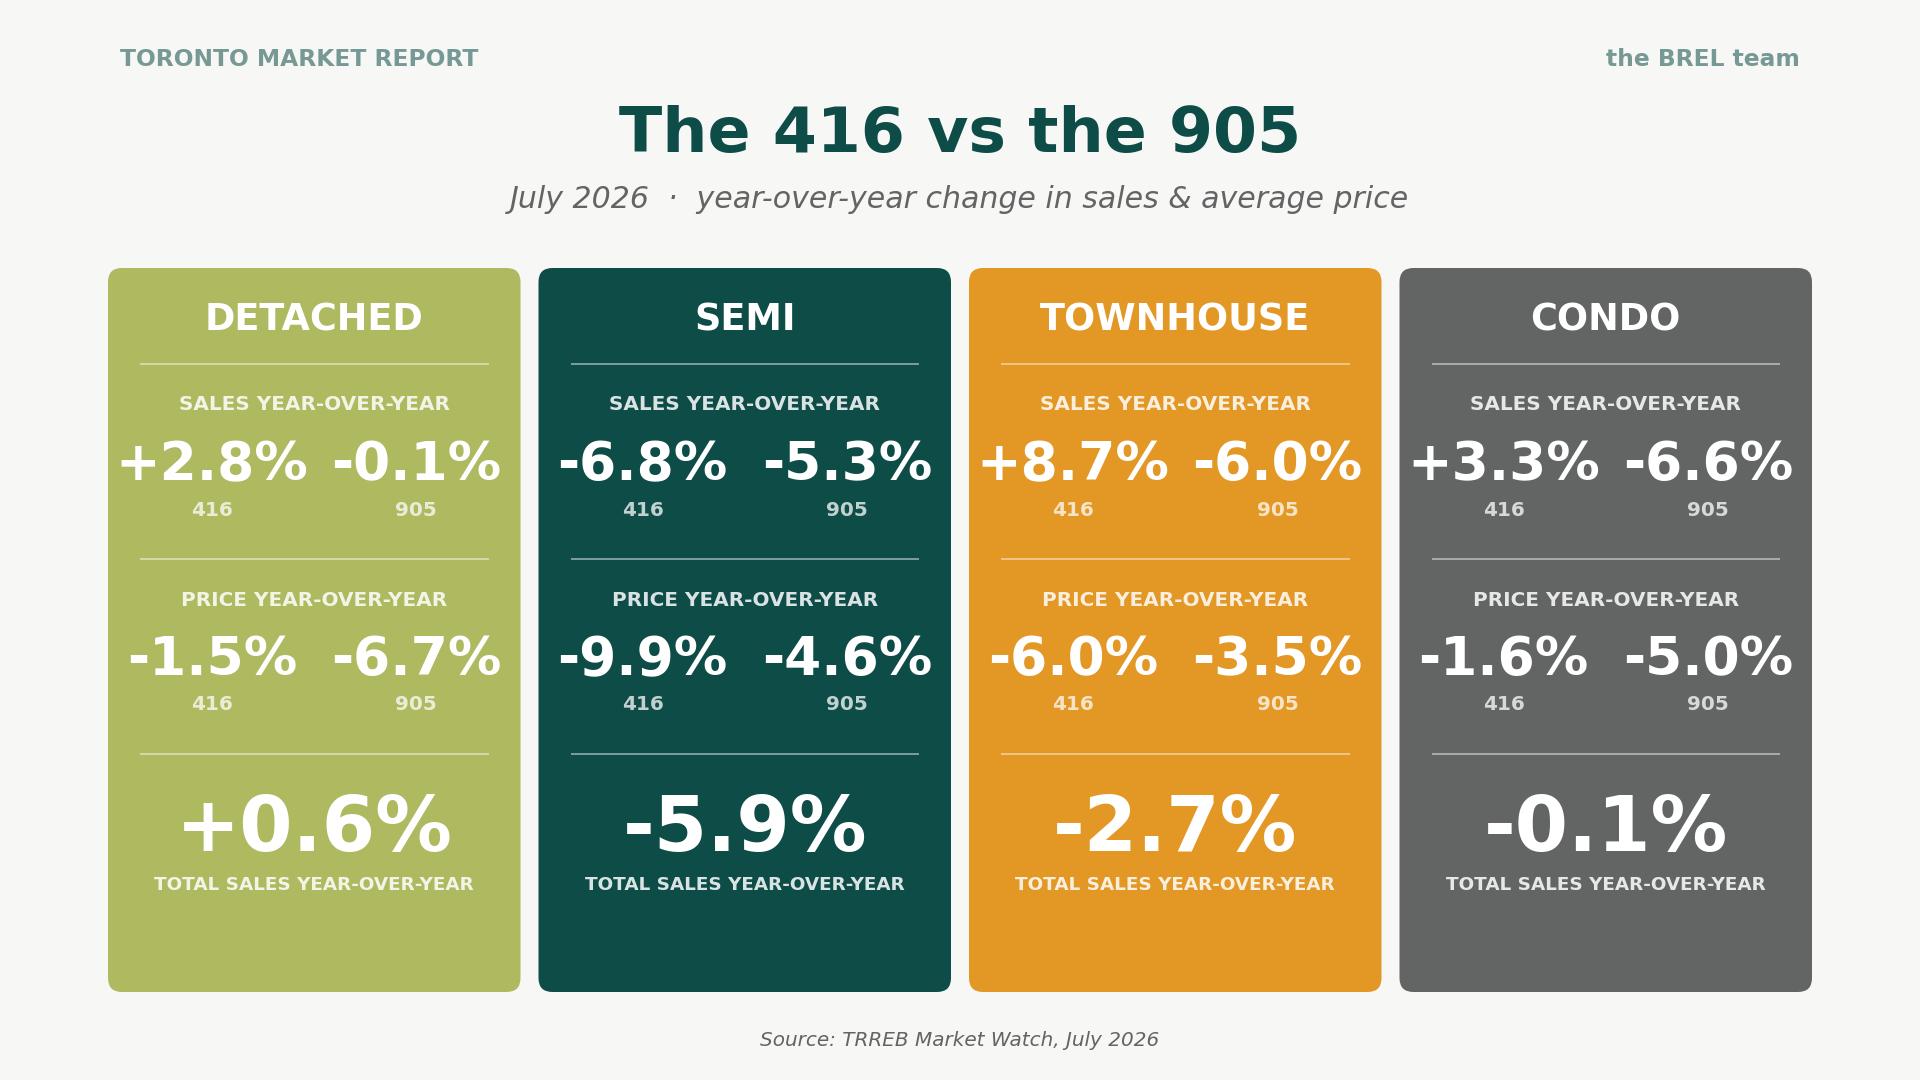
- In the City of Toronto, sales rose year-over-year in three of four property types: detached up 2.8%, townhouses up 8.7%, condos up 3.3%, while detached home prices were down 1.5%.
- Meanwhile in the 905, eveything fell: detached sales essentially flat, semis down 5.3%, townhouses down 6.0%, condos down 6.6%. Detached home prices fell 6.7%.
4. The condo price slide slowed… a lot
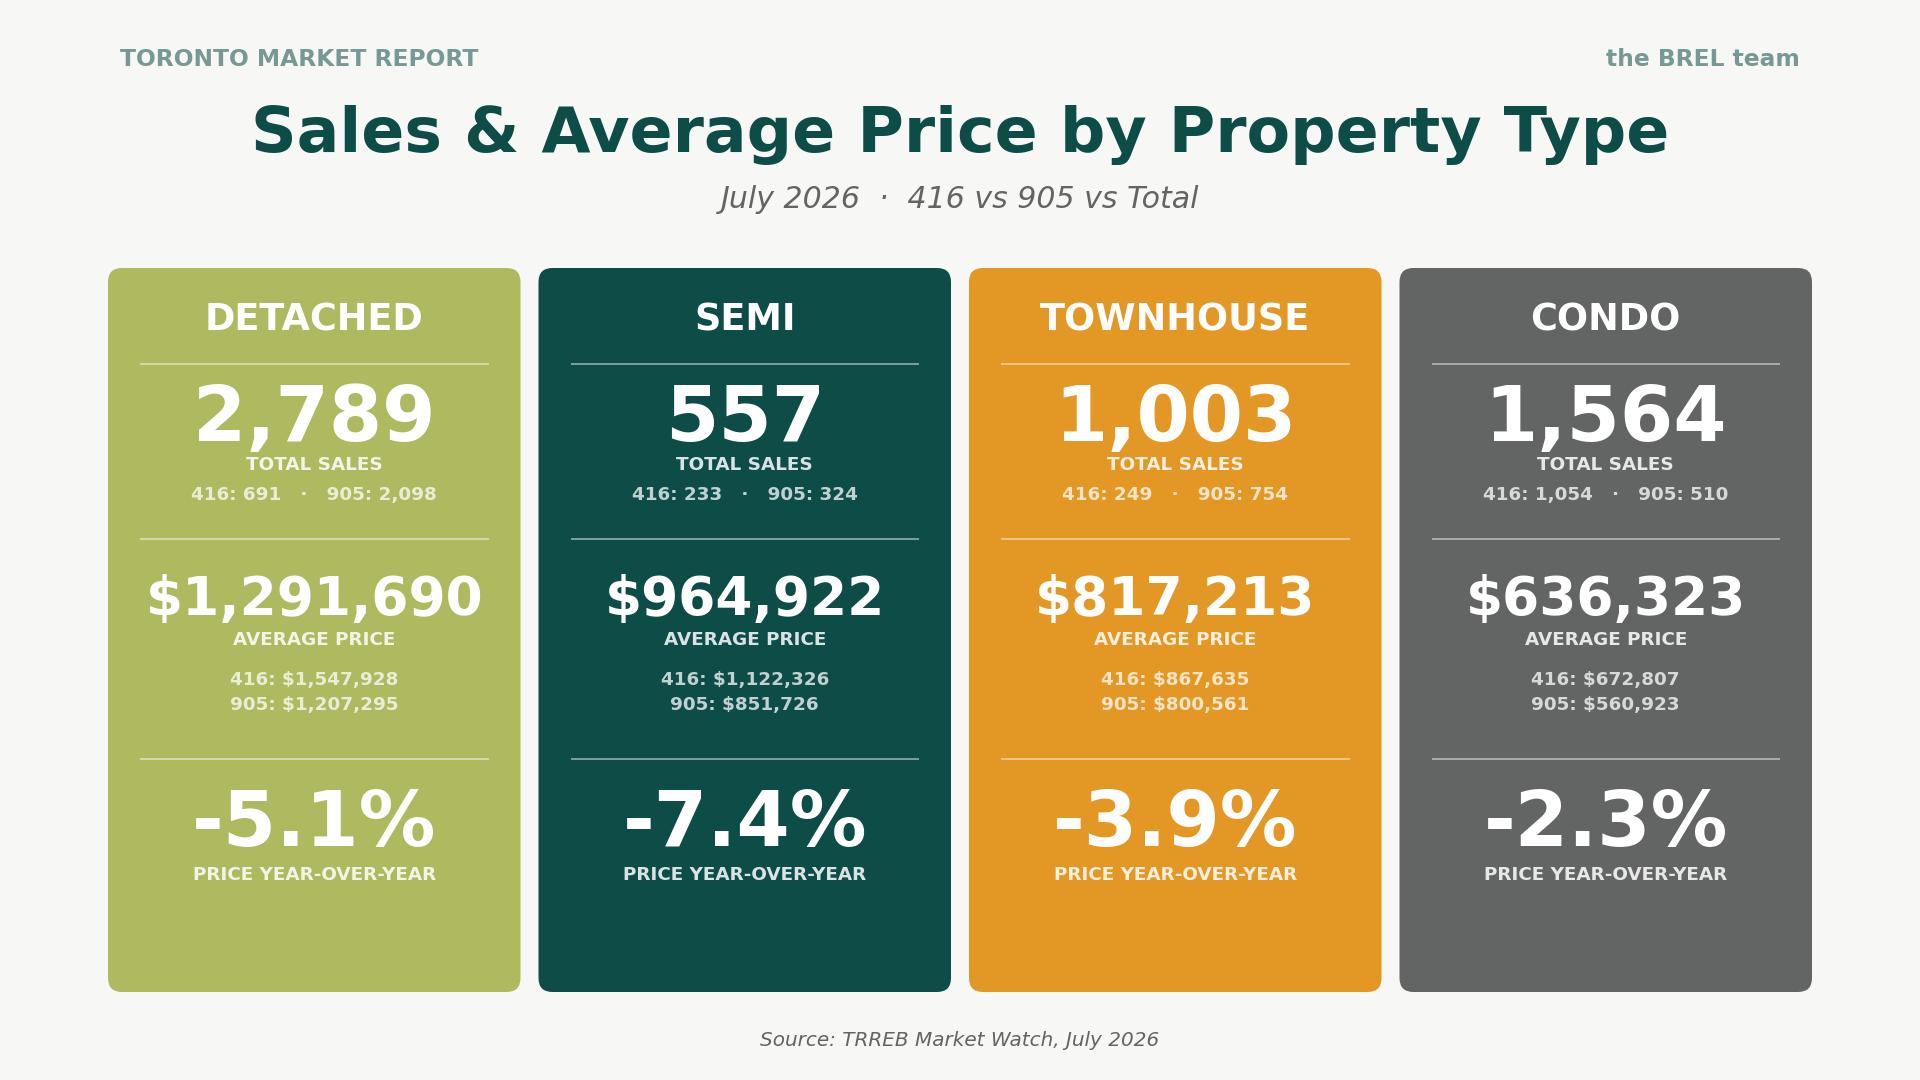
Condos have taken the hardest hit of this correction. In June, condo prices were down 9.5% year over year, the worst of any property type. In July? Down 2.3%, and only 1.6% in the 416.
That’s a dramatic improvement in one month, and the sales data suggests why: buyers have been steadily absorbing the cheap inventory (416 condo sales rose again, up 3.3%). One month isn’t a trend, and the mix of what sold plays a role. But if you’ve been waiting for a sign that condo prices are stabilizing, this report is the first one in a long time that looks like stabilization.
5. The east end and central Toronto are two different markets
The citywide numbers hide a spread that’s getting hard to ignore, and it holds across every district we track, not just the extremes.
- The three core east-end districts sold above asking in July, taking 22 to 27 days (including relistings), with just 2.3-2.7 months of inventory:
- E01 (Riverdale/Leslieville) at 104%
- E02 (the Beaches) at 103%
- E03 (the Danforth corridor) at 102%, taking 22 to 27 days once relistings are counted, on just 2.3 to 2.7 months of inventory.
- The three core central districts we track sold below asking, taking 39-51 days to sell with 5-6 months of inventory
- C01 (King West/Liberty Village) at 97%
- C08 (St. Lawrence/Cabbagetown) at 96%
- C02 (the Annex/Yorkville) at 94%
That’s a seller’s market and a buyer’s market operating within a 20 minute drive, in the same month, in the same city. The “Toronto market” is a statistical convenience – the market on your block is the on that sets your price.
Neighbourhood Prices: What the HPI Data Tells Us
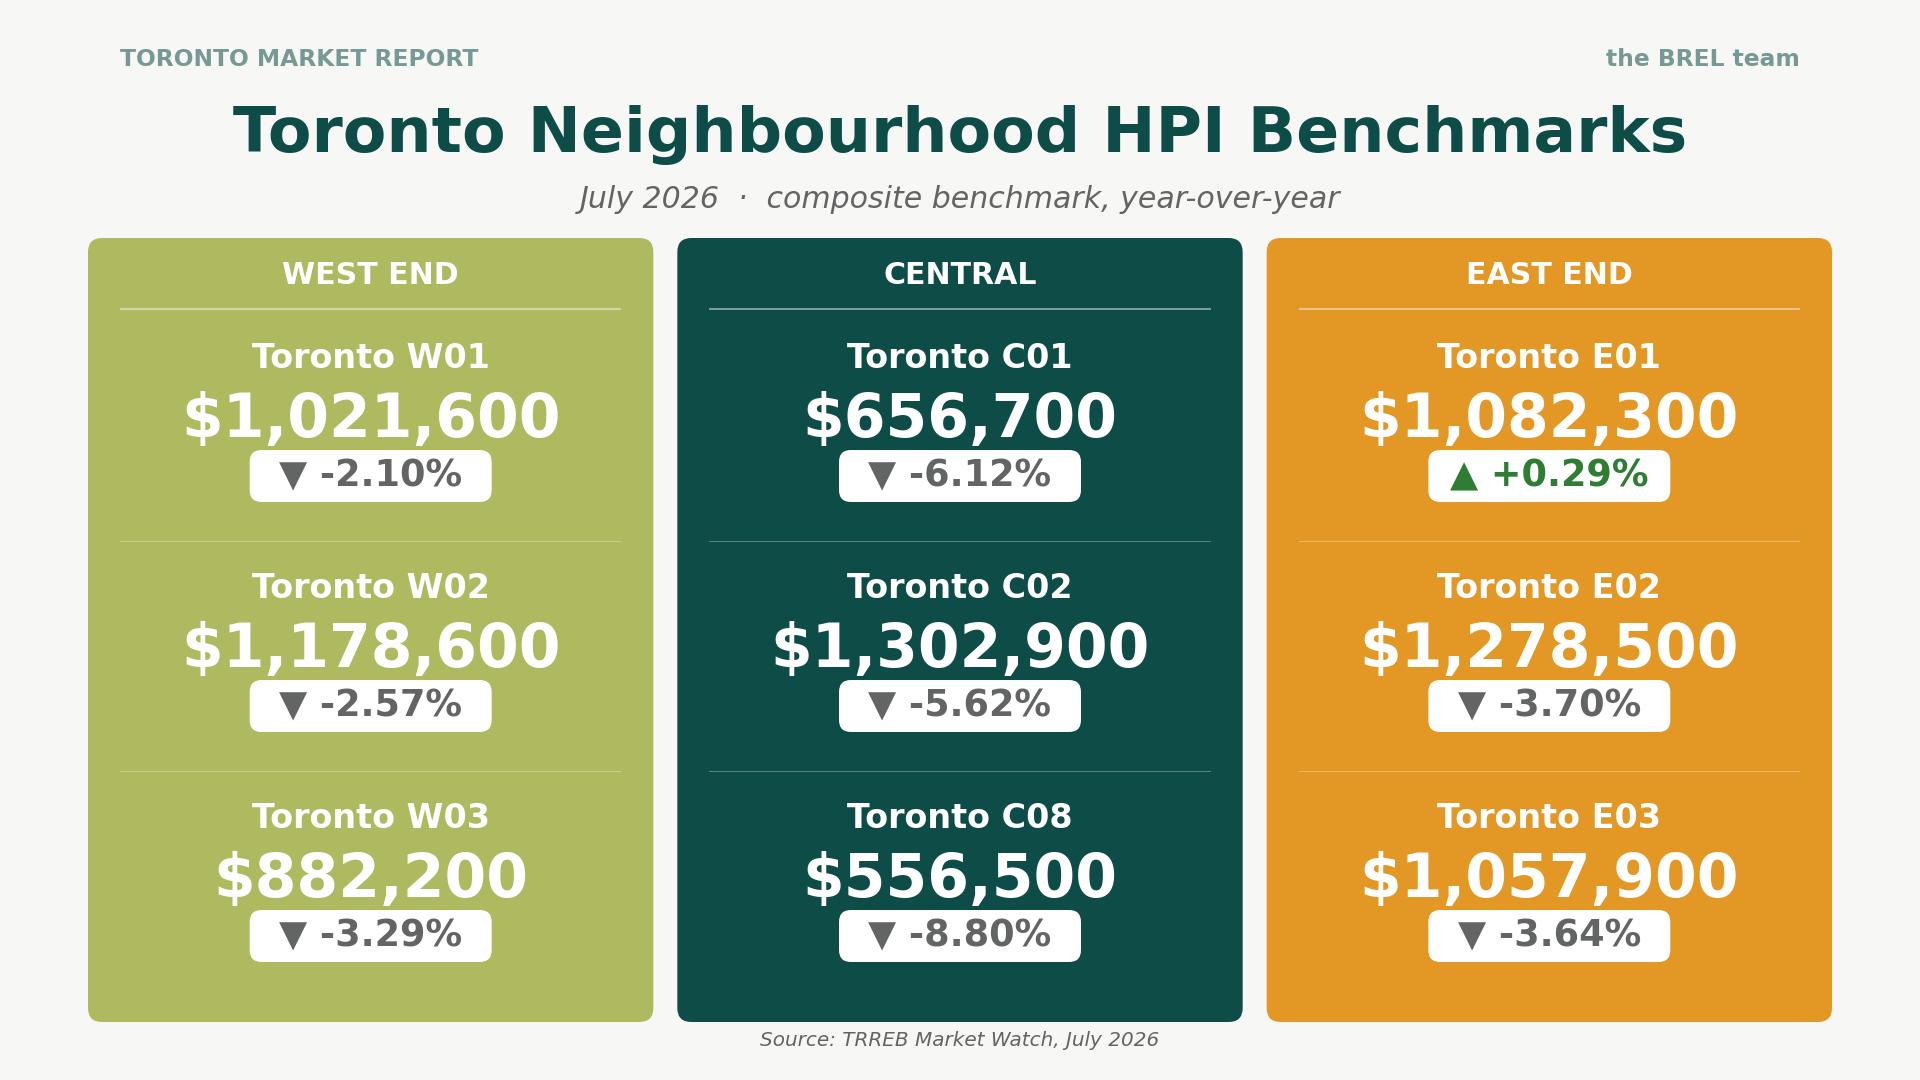
A quick refresher on why we lean on the HPI and not average prices for neighbourhood comparisons. The average just tells you what happened to sell that month. If a few multimillion-dollar homes trade and the small condos sit, the average jumps, and it tells you nothing about whether prices actually moved. The MLS Home Price Index tracks a benchmark “typical” home in each area over time, so it filters out that mix-shift noise. The numbers below are July 2026 benchmarks and their year-over-year change.
Click through the images to see detailed community real estate stats.
West End
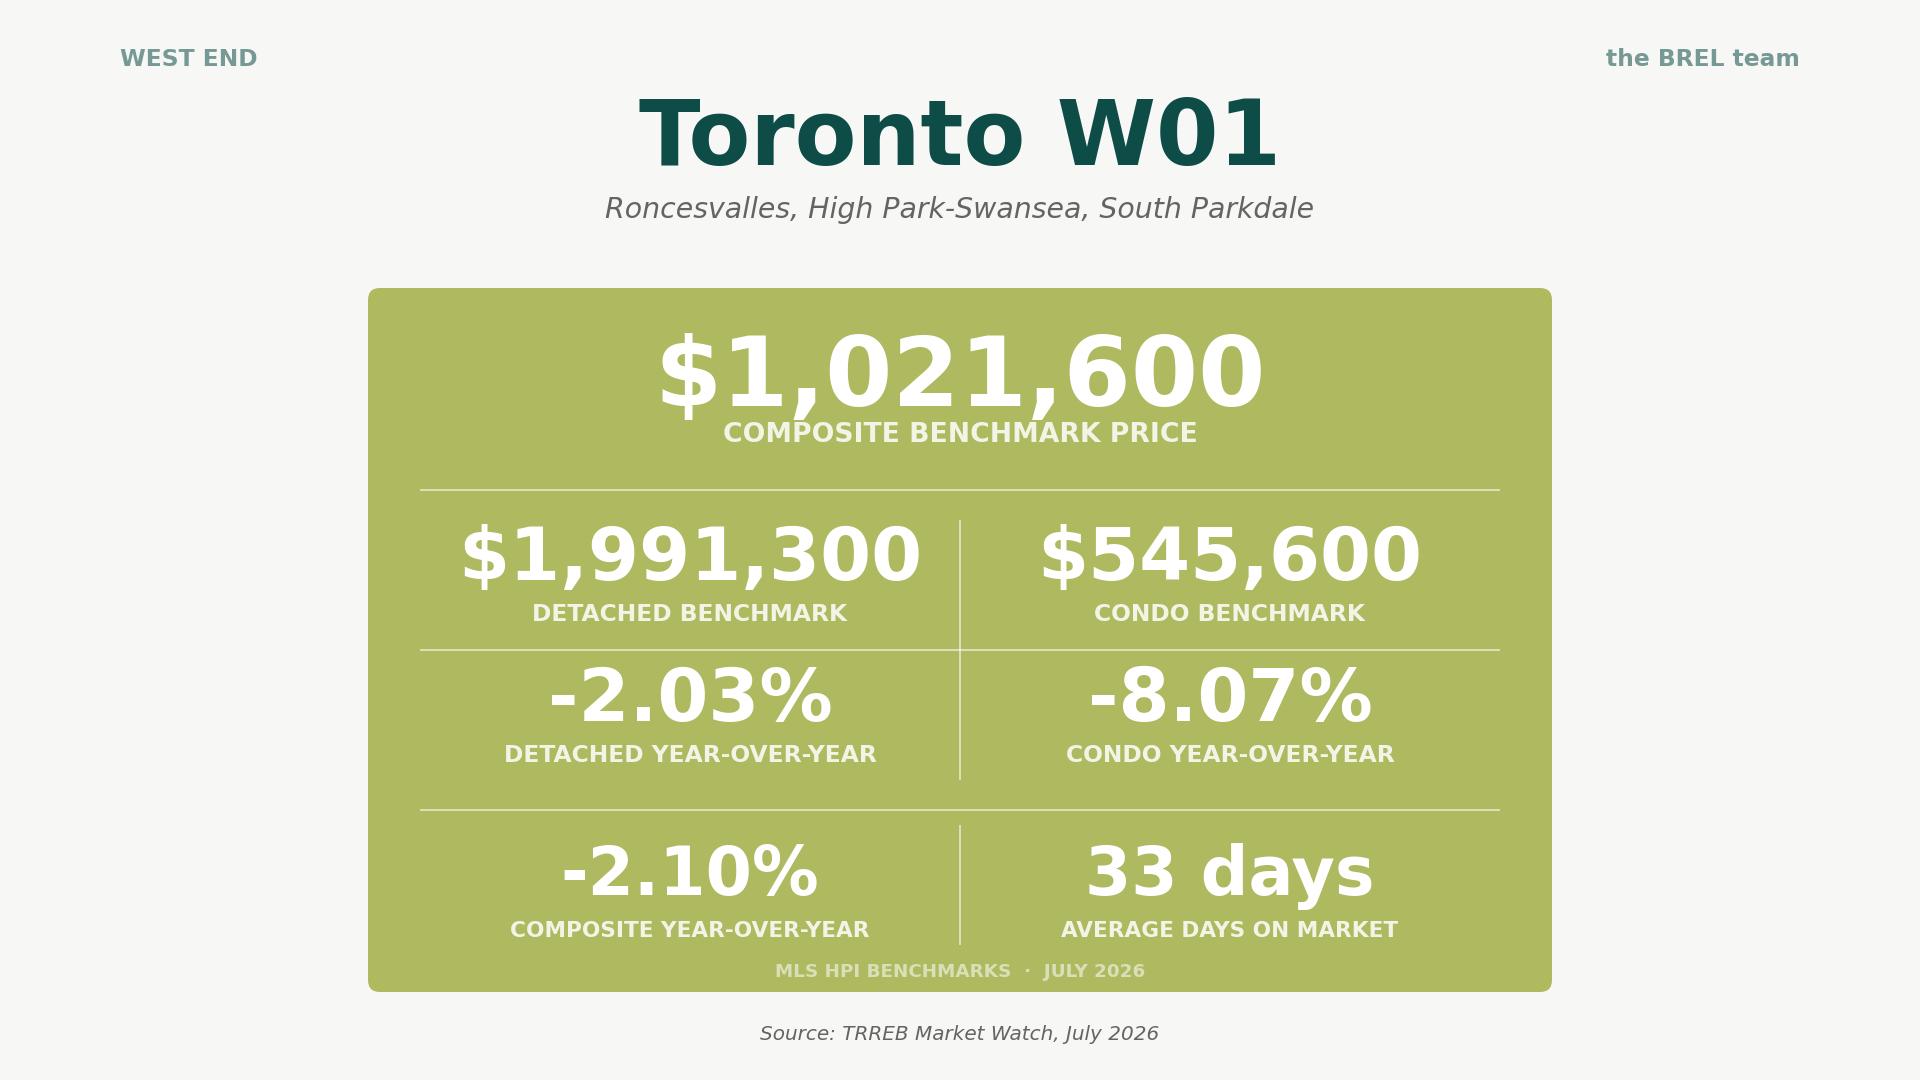
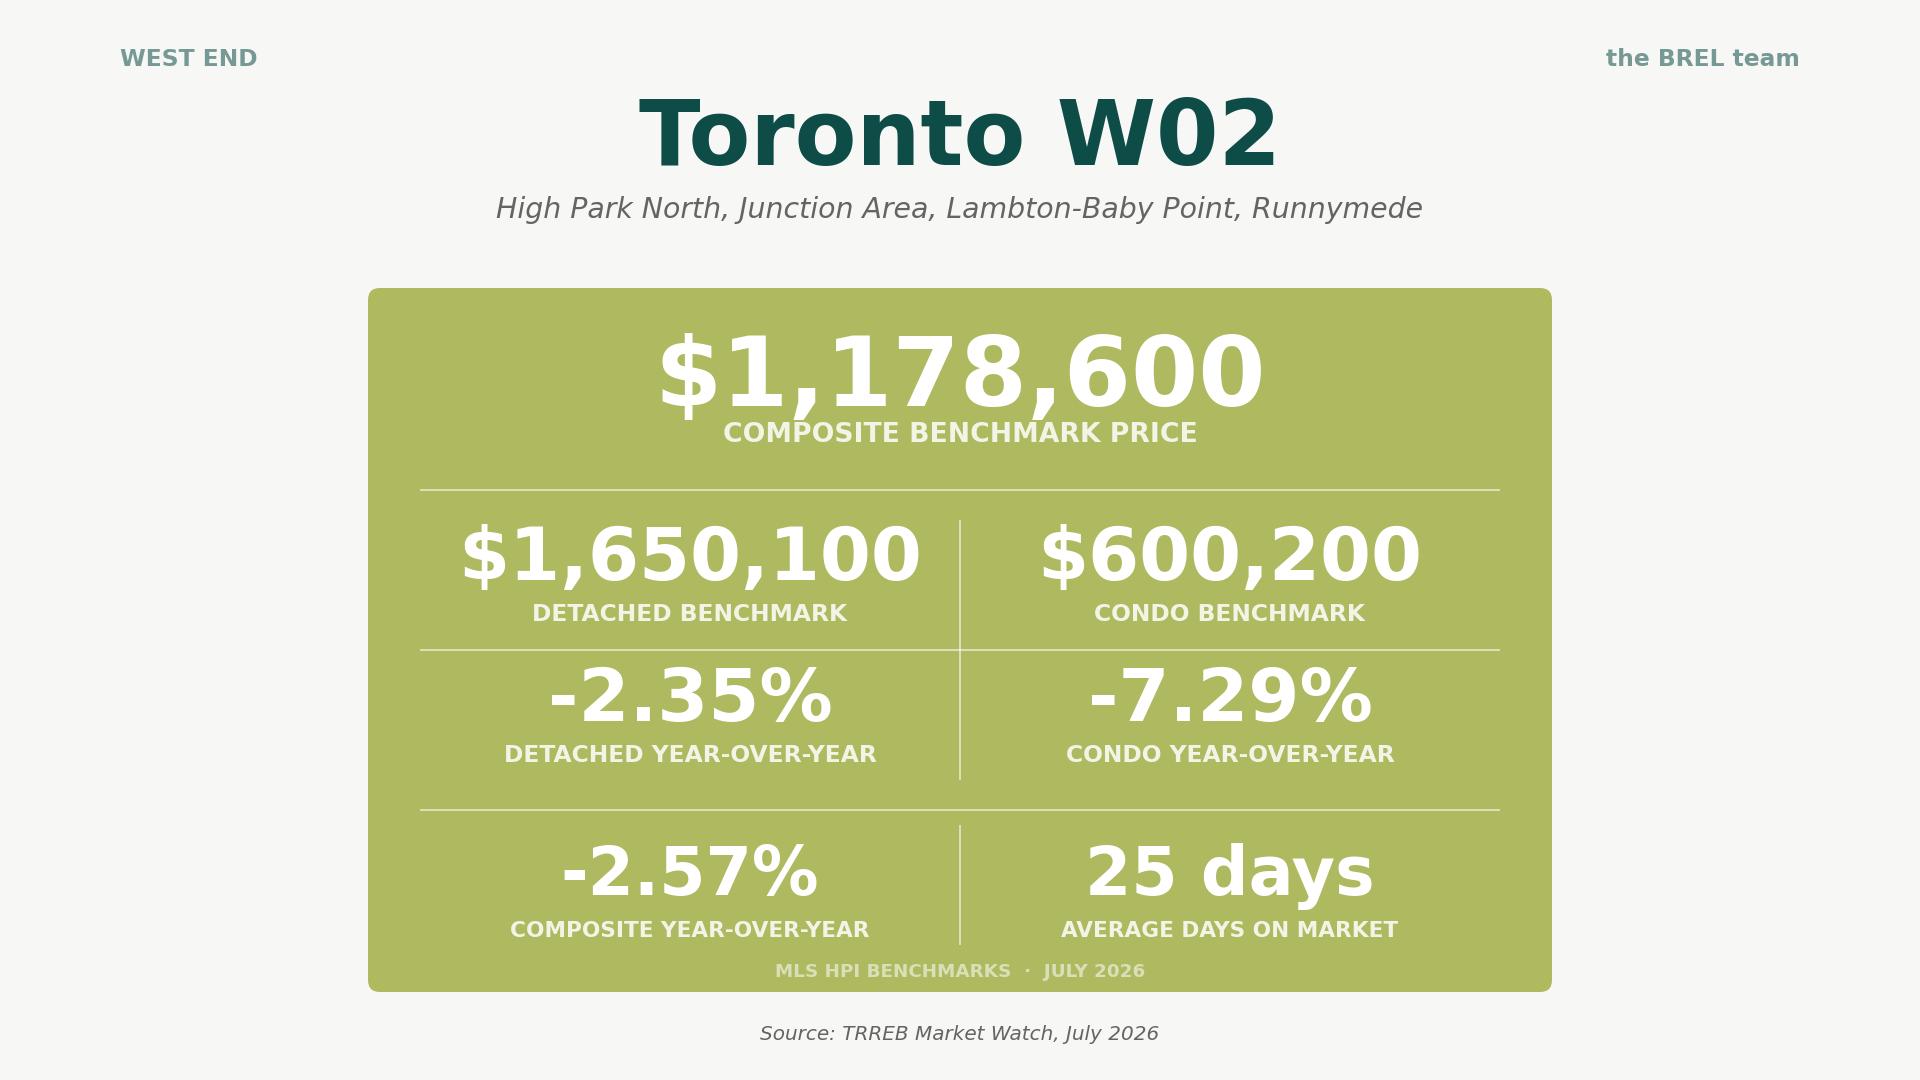
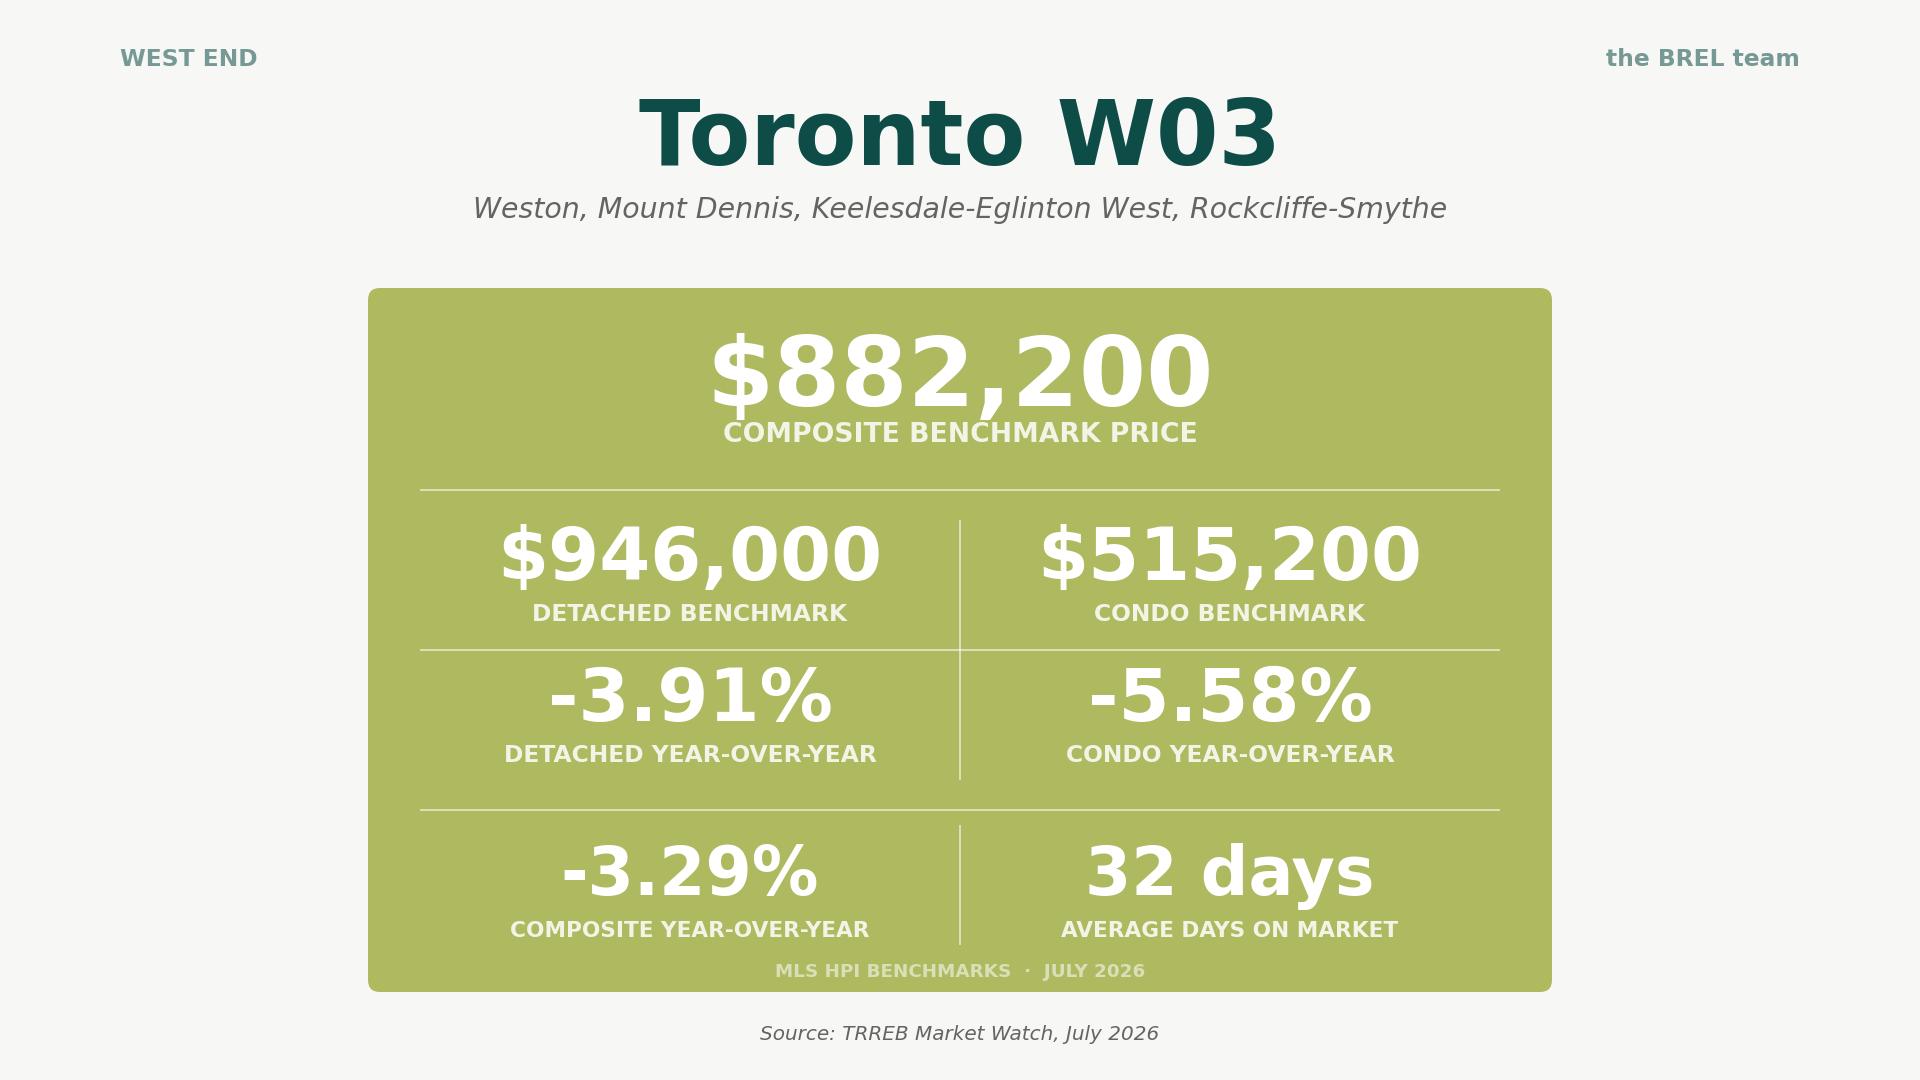
Click through the images to see detailed community real estate stats.
Takeaway: The west end just posted its best-looking board in months. Every composite decline is smaller than it was in June, If you’ve been waiting out Roncesvalles or the Junction, the discount window is narrowing.
Central Toronto
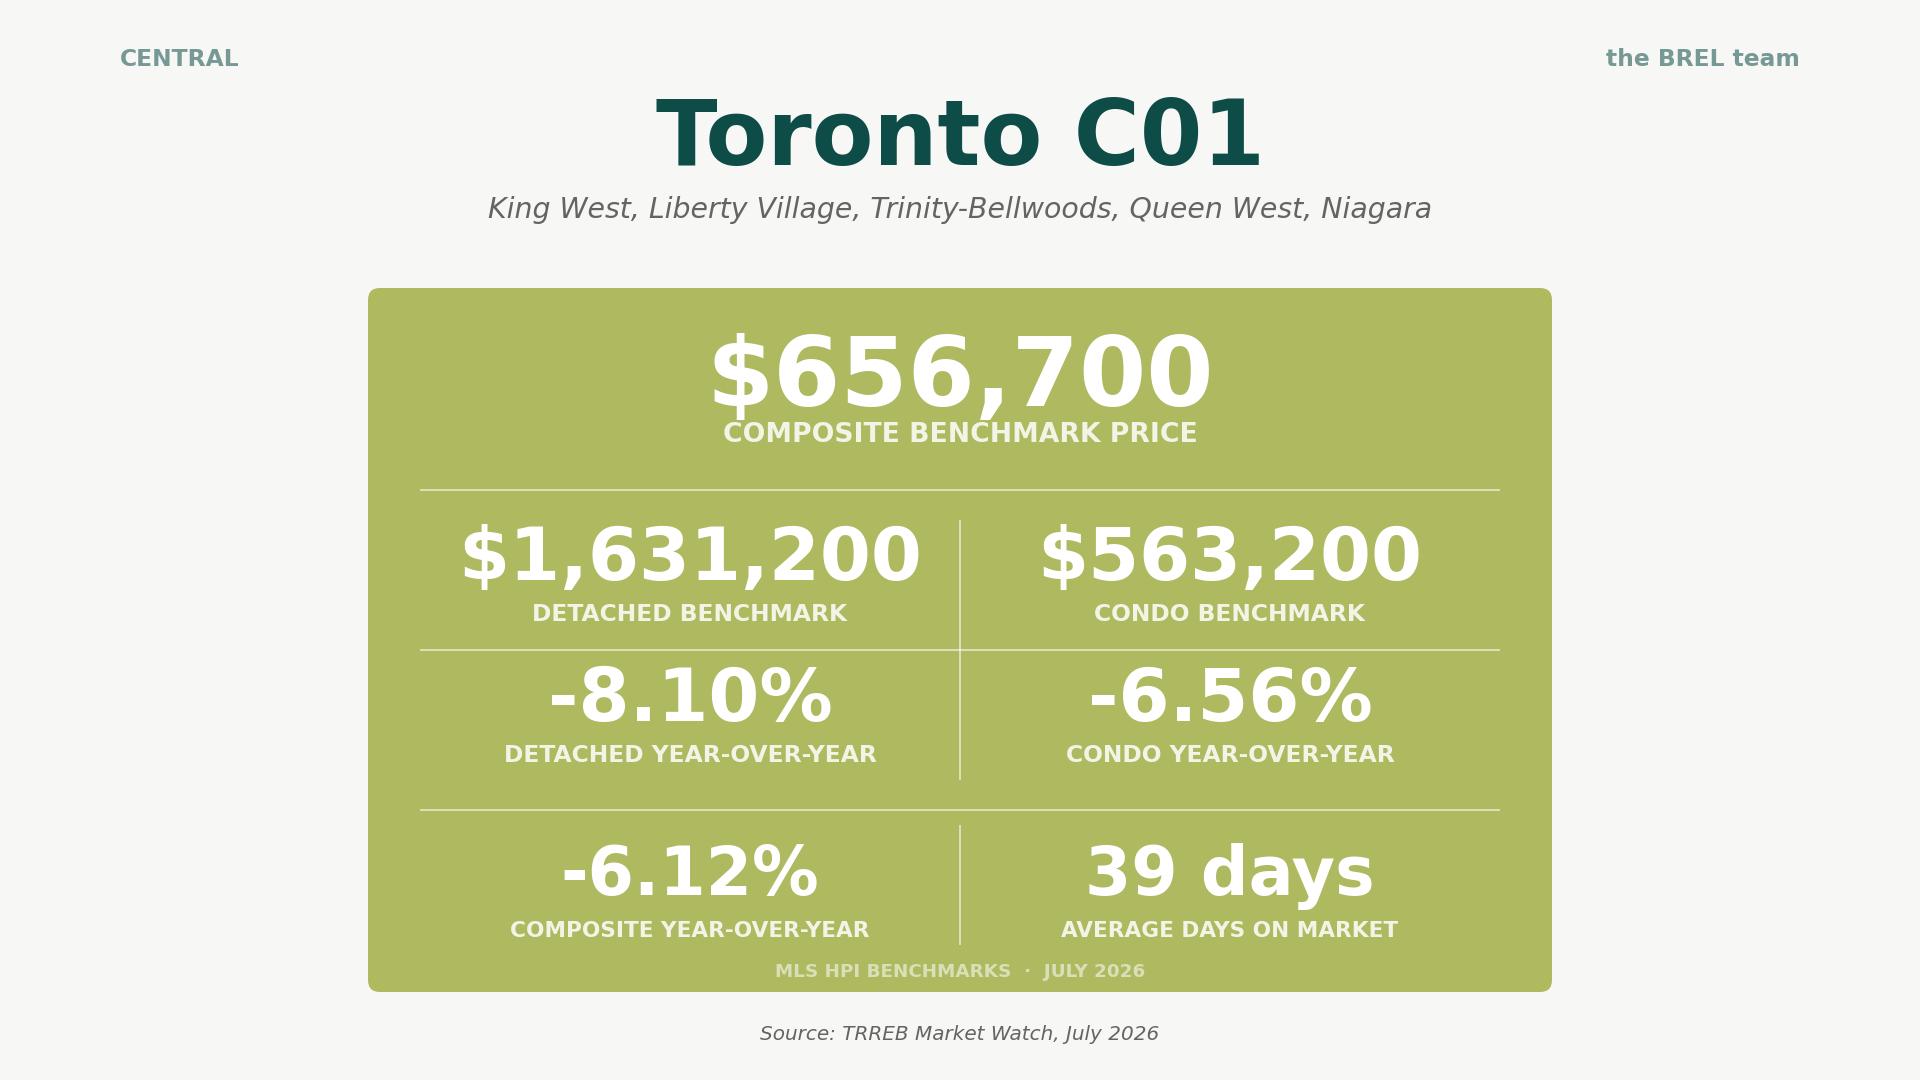
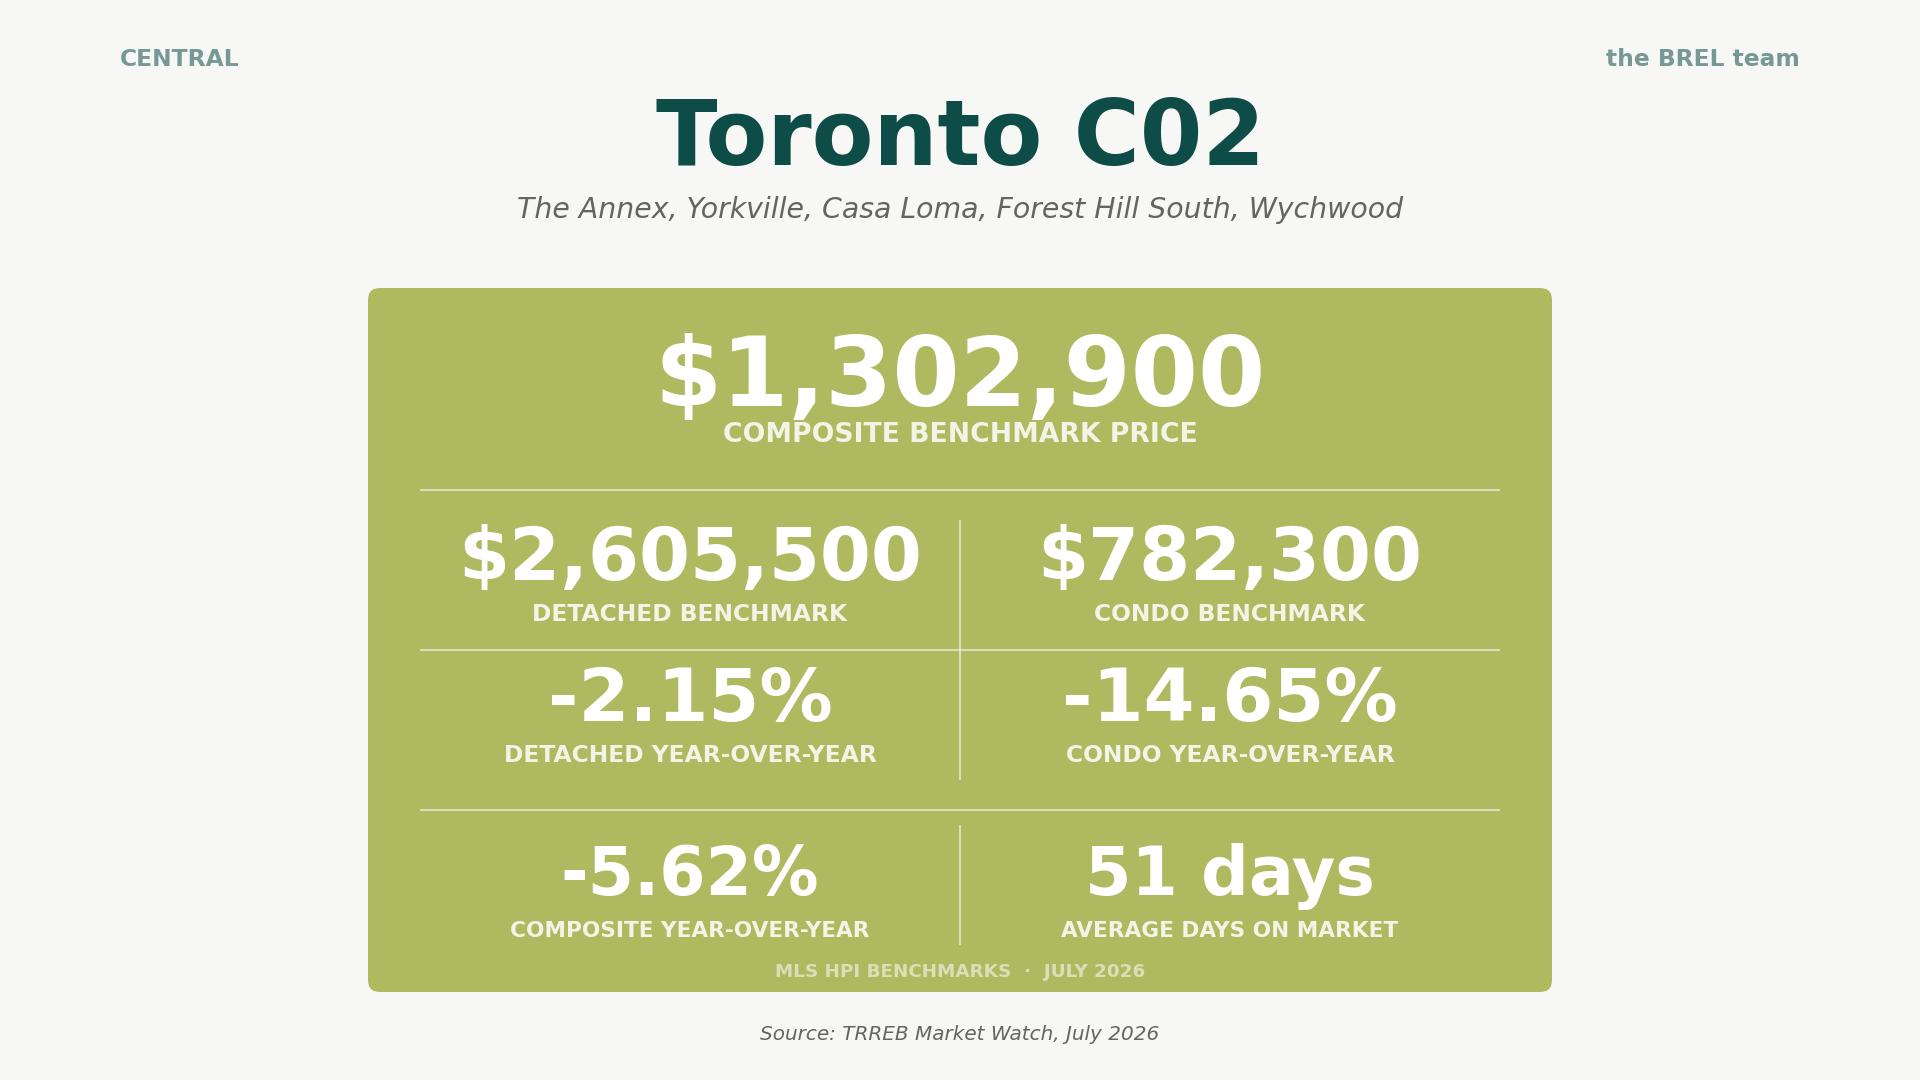
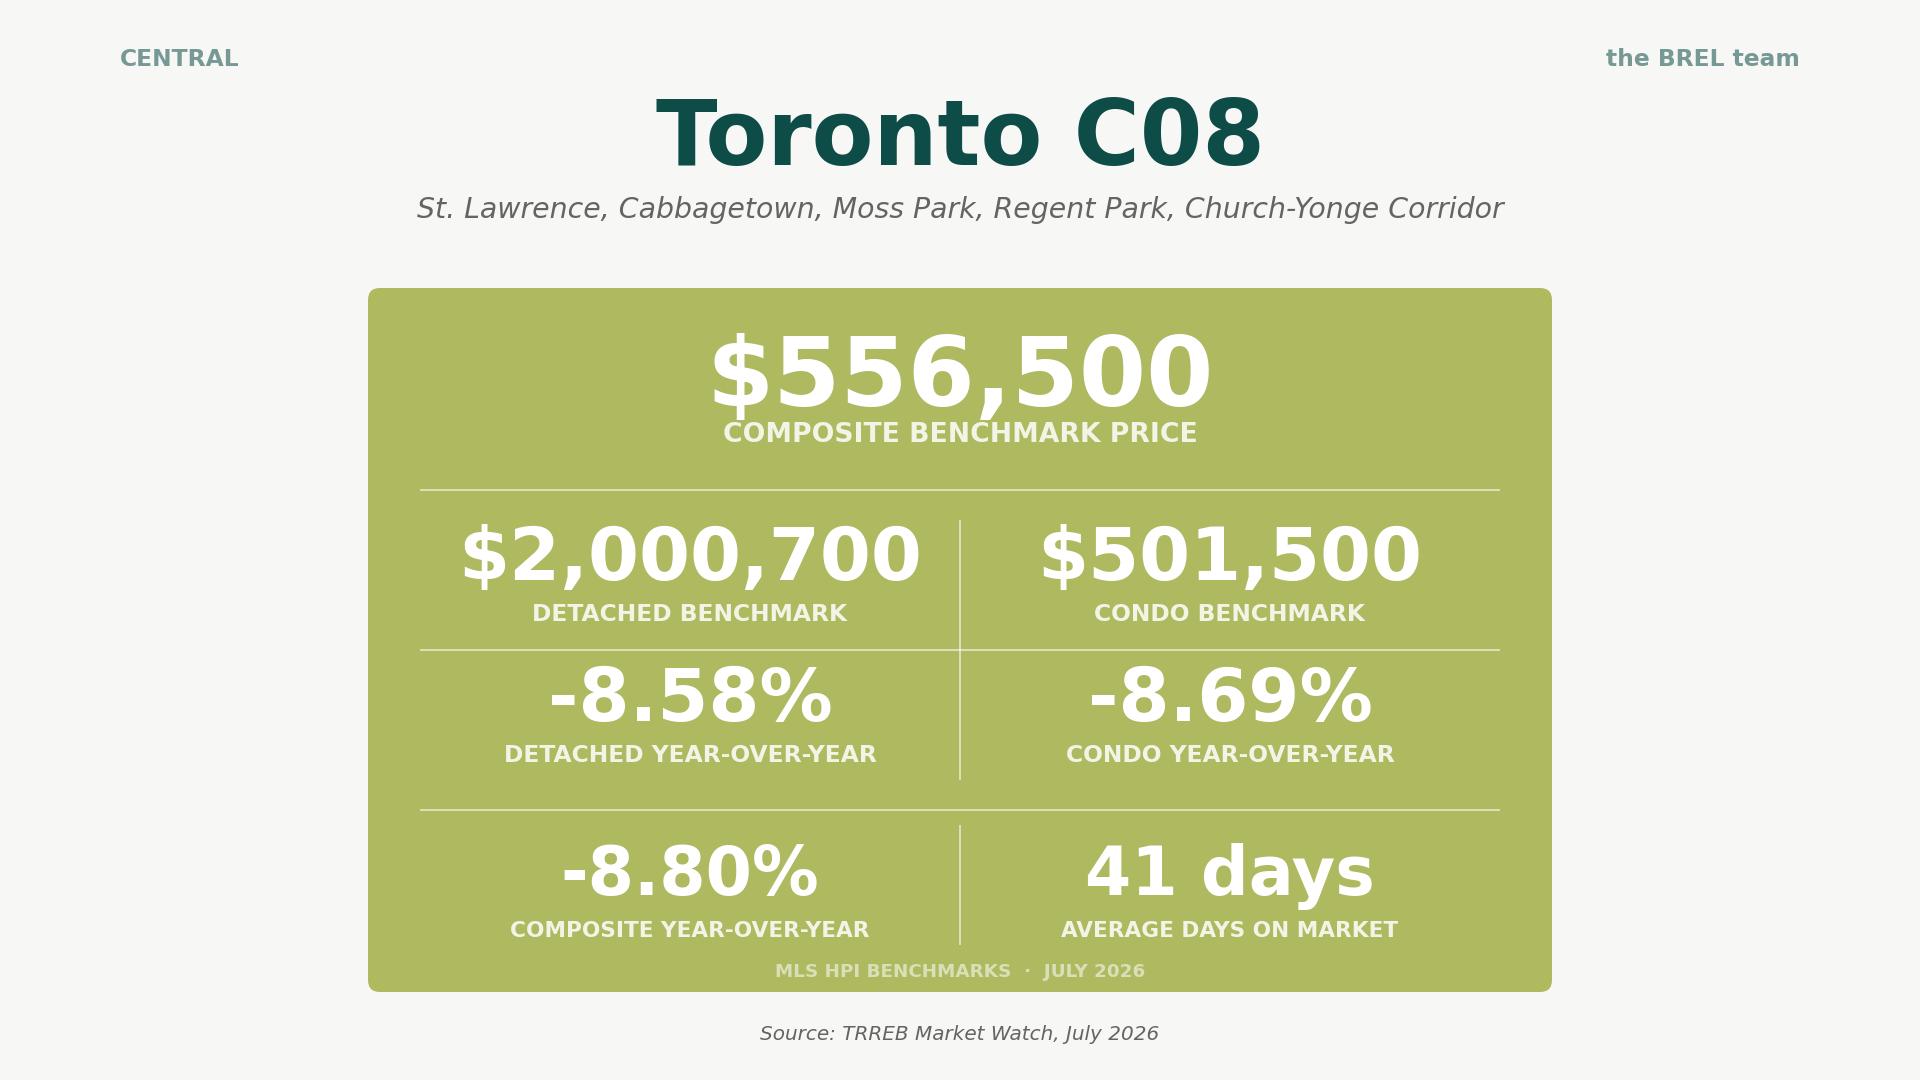
Click through the images to see detailed community real estate stats.
Takeaway: The pattern hasn’t changed: condo-heavy central districts carry the discounts. For buyers who want central addresses, this remains the best leverage in the city. For sellers here, pricing realistically isn’t optional – it’s where you start.
East End
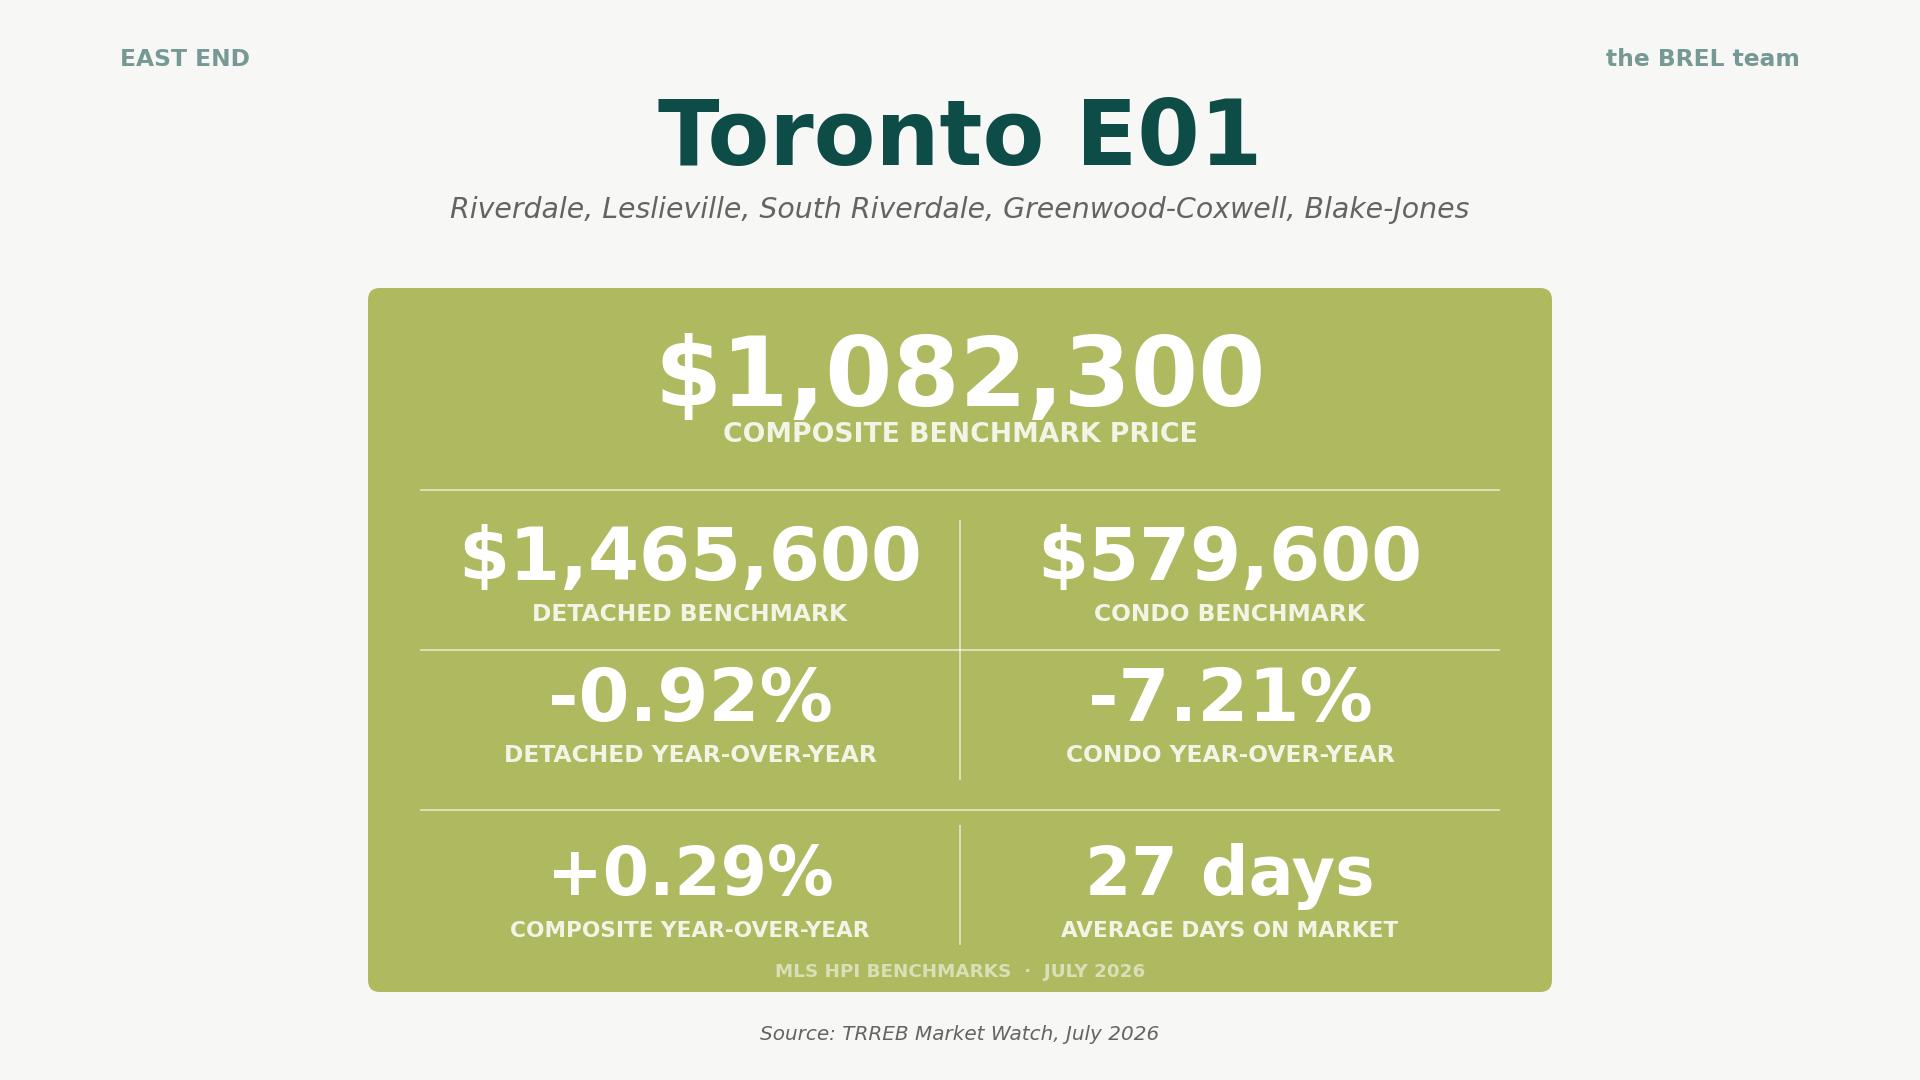
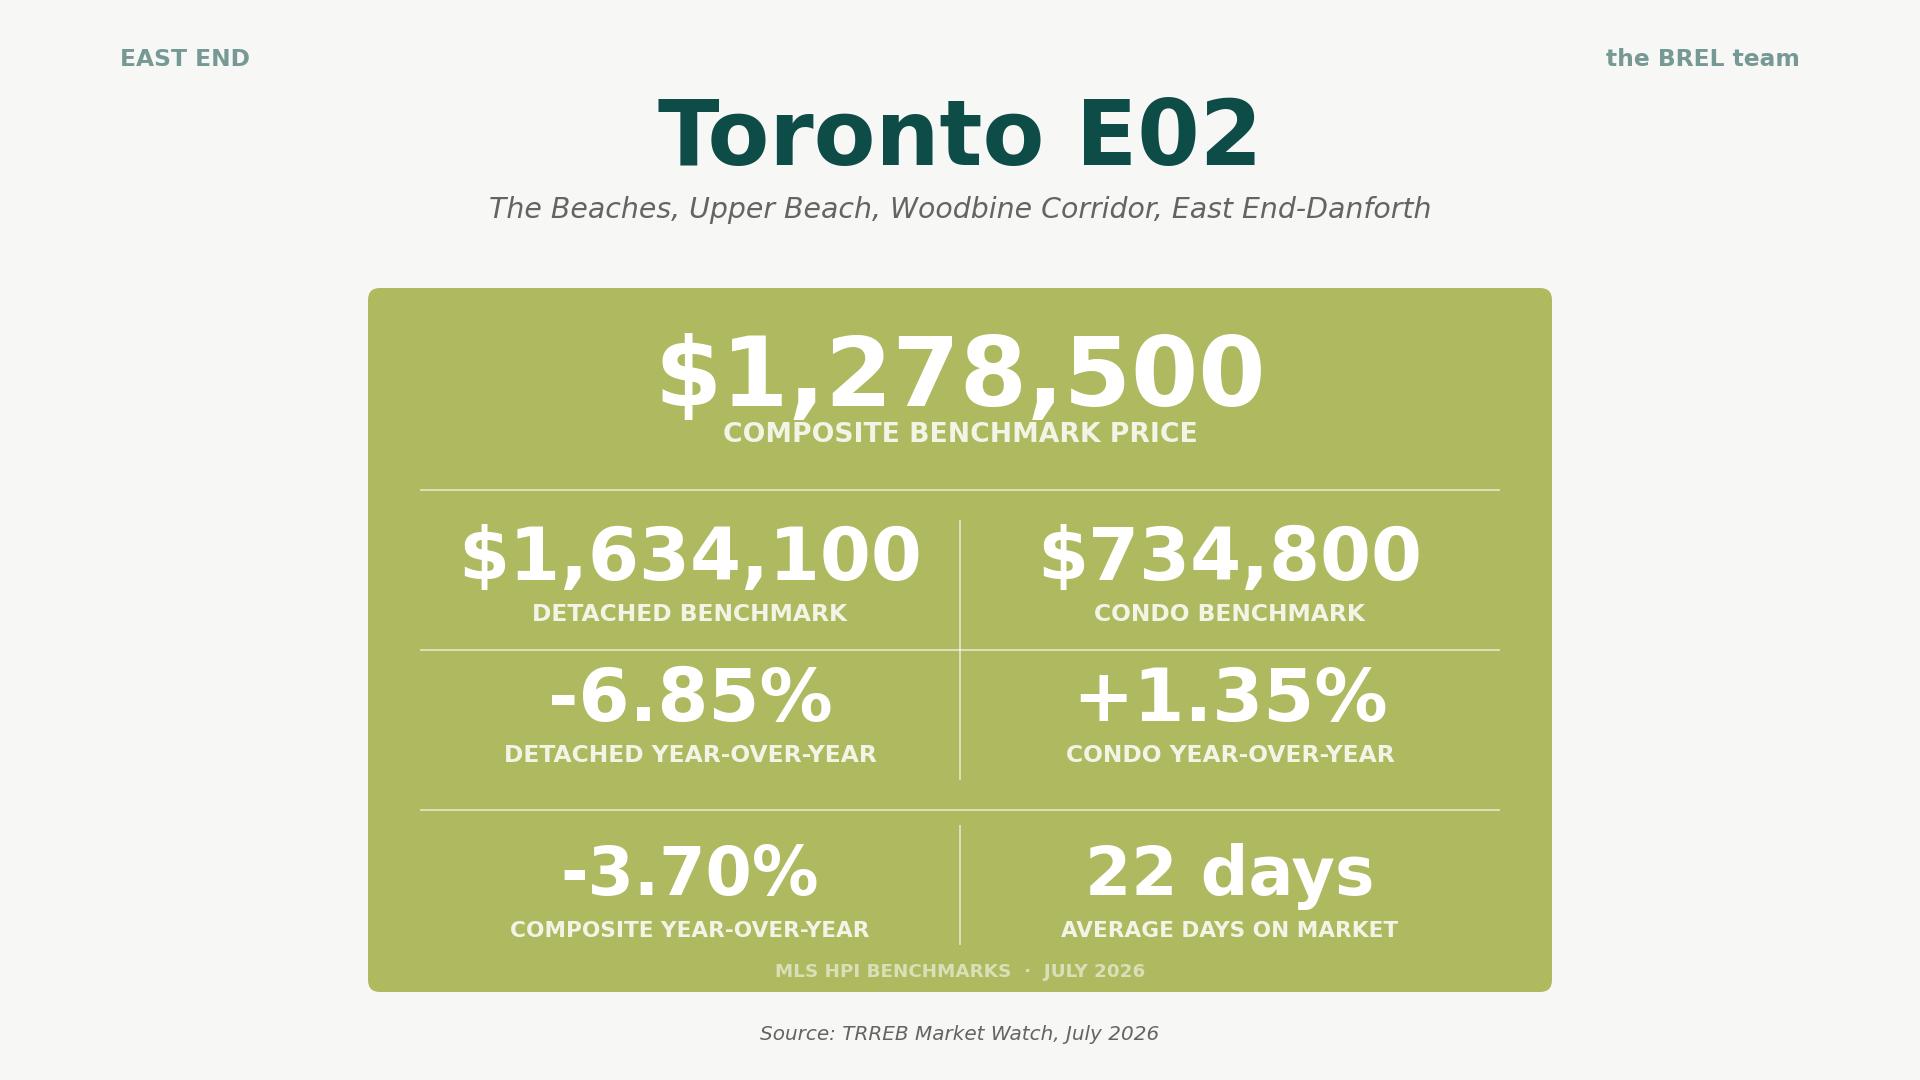
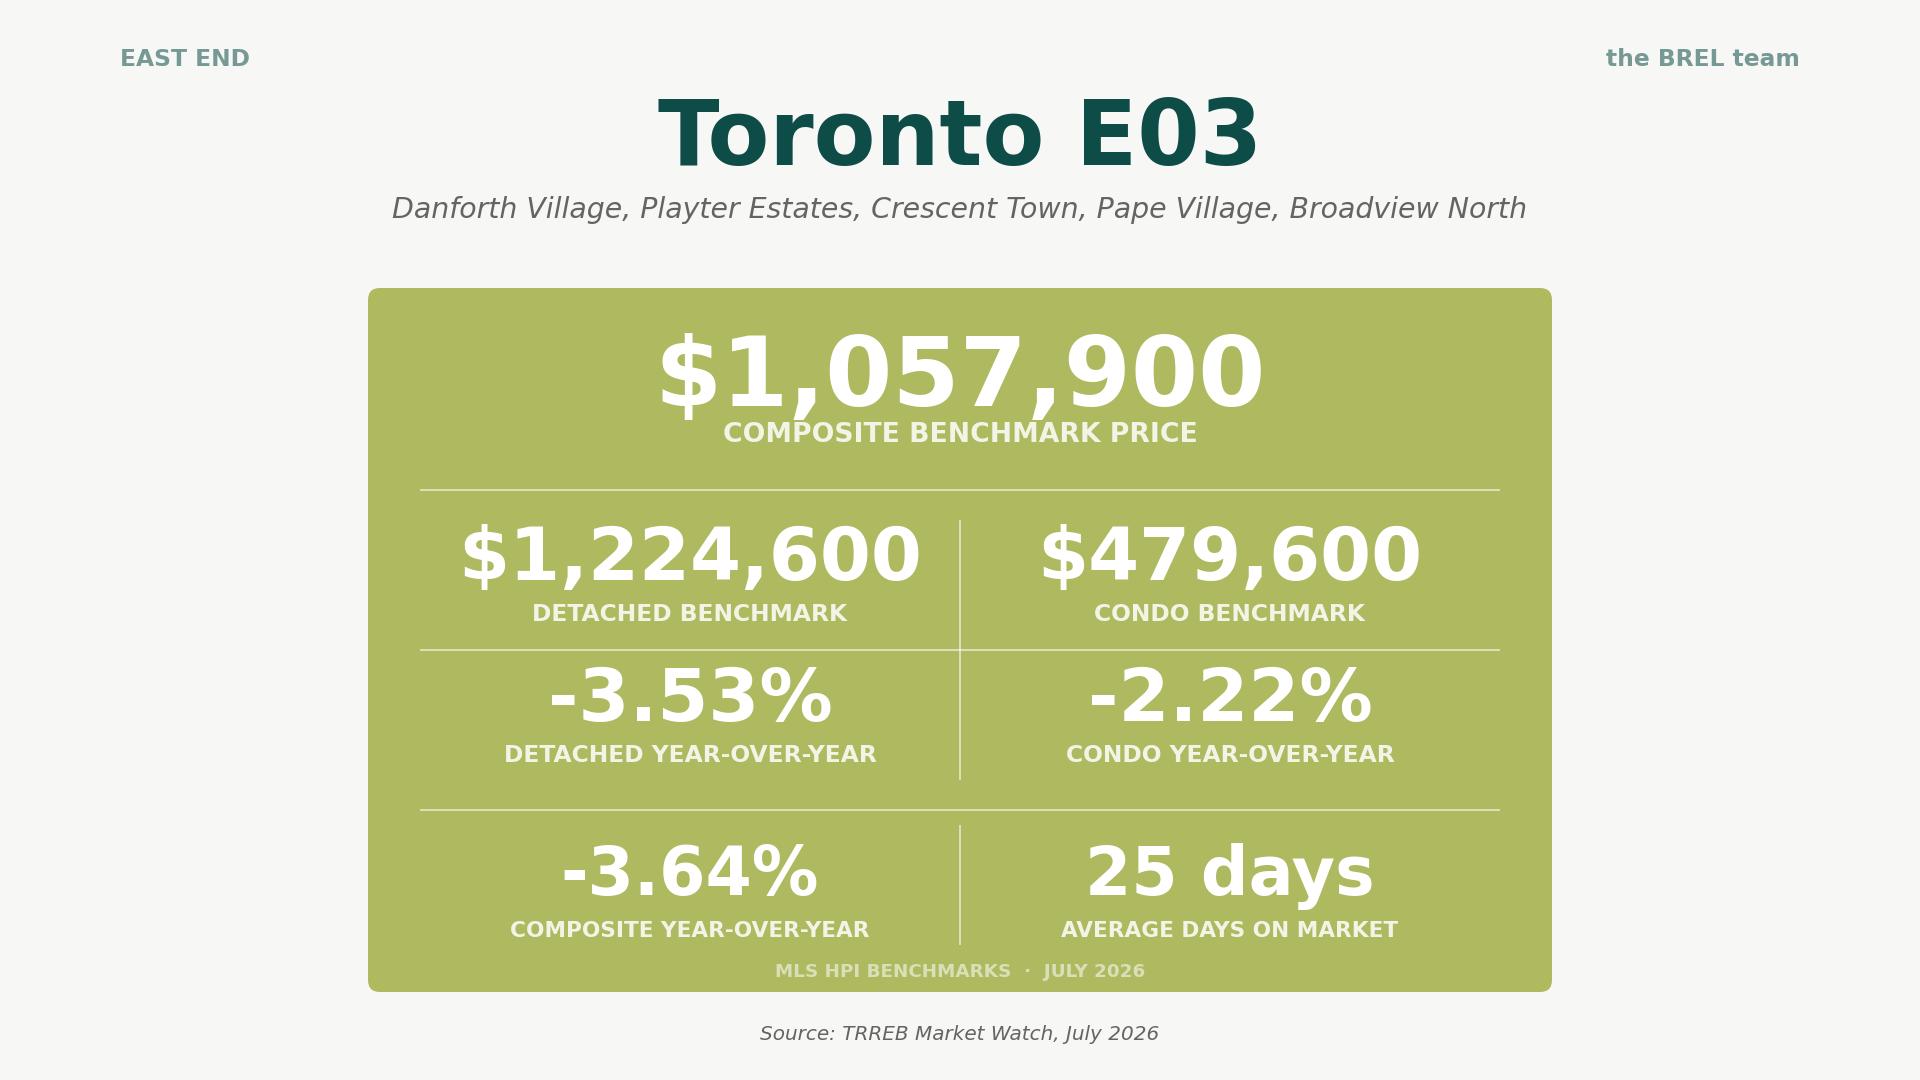
Click through the images to see detailed community real estate stats.
Takeaway: The east end remains the strongest corner of the city. The east end isn’t cheap and isn’t getting cheaper, it’s just fast. Buyers here should come prepared to compete; sellers here are among the few in the city who can still get multiple interested buyers.
What Else You Need to Know: July 2026 Real Estate News
The Bank of Canada held at 2.25%, and inflation just gave it cover
The Bank held its overnight rate at 2.25% on July 15, its sixth consecutive hold, keeping prime at 4.45%. Two weeks earlier that looked uncomfortable, because May’s inflation had spiked to 3.2%. Then June’s CPI came in at 2.8%, with the monthly index posting its largest decline since December 2024 as gasoline cooled. That doesn’t guarantee cuts, the Bank was clear it’s watching tariffs and the Middle East, but it takes the year-end hike chatter mostly off the table, which is good news for anyone renewing a mortgage this fall.
CMHC now expects sales AND prices to fall this year
CMHC’s mid-year update to its Housing Market Outlook, released July 22, downgraded the national picture: it now projects roughly 457,200 sales in 2026 at an average price of $675,200, both lower than 2025, citing economic uncertainty, slower population growth and still-high borrowing costs.
CREA’s own July 15 revision trimmed its national sales forecast too, though it expects Ontario to be the only province where sales rise this year. Read those together: the national housing story is soft, and the GTA, after three years of correcting first and hardest, is now expected to be the relative bright spot.
New condo sales rose for the first time in three years, with an asterisk
Urbanation reports GTHA new condo sales jumped 52% year over year in Q2 to 702 units, the first annual increase in nearly three years. The asterisk: almost all of that came from developers discounting completed, ready-to-move-in units. True pre-construction pre-sales fell about 80%, and RBC Economics describes the pre-construction pipeline as frozen, with new supply additions near zero and the largest decline in condo completions on record coming in the next few years. Today’s standing-inventory deals and tomorrow’s supply crunch are the same story, a few years apart.
Rents have stopped falling. Almost.
Toronto’s average asking rent sat around $2,410 as of August 1, down about 2% year over year but up from May, and rent trackers are calling it an early sign of stabilization after two years of declines. For condo investors, flat rents plus stabilizing condo prices (see item 4 above) is the first month in a while where the math has stopped getting worse. For tenants, the window of falling rents may be closing.
The jobs picture: better nationally than in Toronto
Canada added about 18,200 jobs in June and the national unemployment rate ticked down to 6.5%, a genuine upside surprise that TRREB’s economists flagged as a possible confidence-builder for buyers. Toronto’s own unemployment rate, though, still sits at 7.2%, and manufacturing has shed roughly 61,000 jobs nationally since tariff uncertainty began in early 2025. A national labour market that’s improving while the local one lags is one more reason GTA demand recovers in fits and starts rather than all at once.
Advice for Toronto Buyers
The core facts haven’t changed: prices are still 4.6% below last year on the HPI, there’s a lot of inventory at 4.6 months, and the average home is taking 45 days to sell once relistings are counted. You still have leverage. What July adds is a warning about where that leverage is thinning. New listings are drying up, condo price declines just narrowed sharply, and the west end’s discounts shrank in a single month.
If you’re shopping central Toronto condos you’re still firmly in control, take your time and negotiate. If you’re shopping east-end freehold homes, you’re not in control, and lowballing a Riverdale semi that will sell at 104% of asking will only end in disappointment.
Get the pre-approval done, watch how long properties are taking to sell (including relistings) and if a fall rate cut is your plan for affordability, remember the Bank has now held six times in a row. Buy on today’s math, not on a forecast.
Advice for Toronto Sellers
July’s tightening is genuinely good news for you, but understand what kind of tightening it is: your competition stayed home. That means less pressure from rival listings, not a lineup of new buyers, and the clock is still slow, with the average home taking 45 days to sell, longer than last year.
Three things to know:
- Pricing still does most of the work: the sale-to-list spread between the Beaches (103%) and the Annex (94%) is really a pricing-discipline spread. Homes priced to the current market attract competition; homes priced to a past market sit. The Annex’s 51 days on market (vs. the Beaches’ 22 days) show how long that sitting lasts.
- Summer listing opportunity: If you’re in a strong pocket, E01, E02, W02, this is a legitimately good window to list into scarce supply before September brings your competition back.
- If you’re selling a central condo, the stabilizing price data is encouraging but not yet leverage, so presentation, staging and a realistic listing price remain your entire toolkit.
The BREL Bottom Line
July didn’t move much on the surface: sales flat, prices drifting sideways at a lower level than last year. The important shifts happened underneath. Sellers withdrew from the market in the biggest numbers of the year, condo prices posted their smallest annual decline in ages, the 416 outsold the 905, the west end’s discounts narrowed, and the east end kept selling over asking. Inflation cooling to 2.8% removed the nastiest risk hanging over the fall market.
Our read: this is what a market feeling for a floor looks like, uneven, block-by-block, and easily disturbed. If sellers return in force in September, the added supply restores buyers’ leverage. If they don’t, prices levelling off in the second half stops being a prediction and starts being the base case. Either way, the playbook is the one we’ve been handing out all year: buyers, use the leverage where it still exists and be realistic where it doesn’t; sellers, price for the buyer who’s reading exactly this data, because increasingly, they all do.