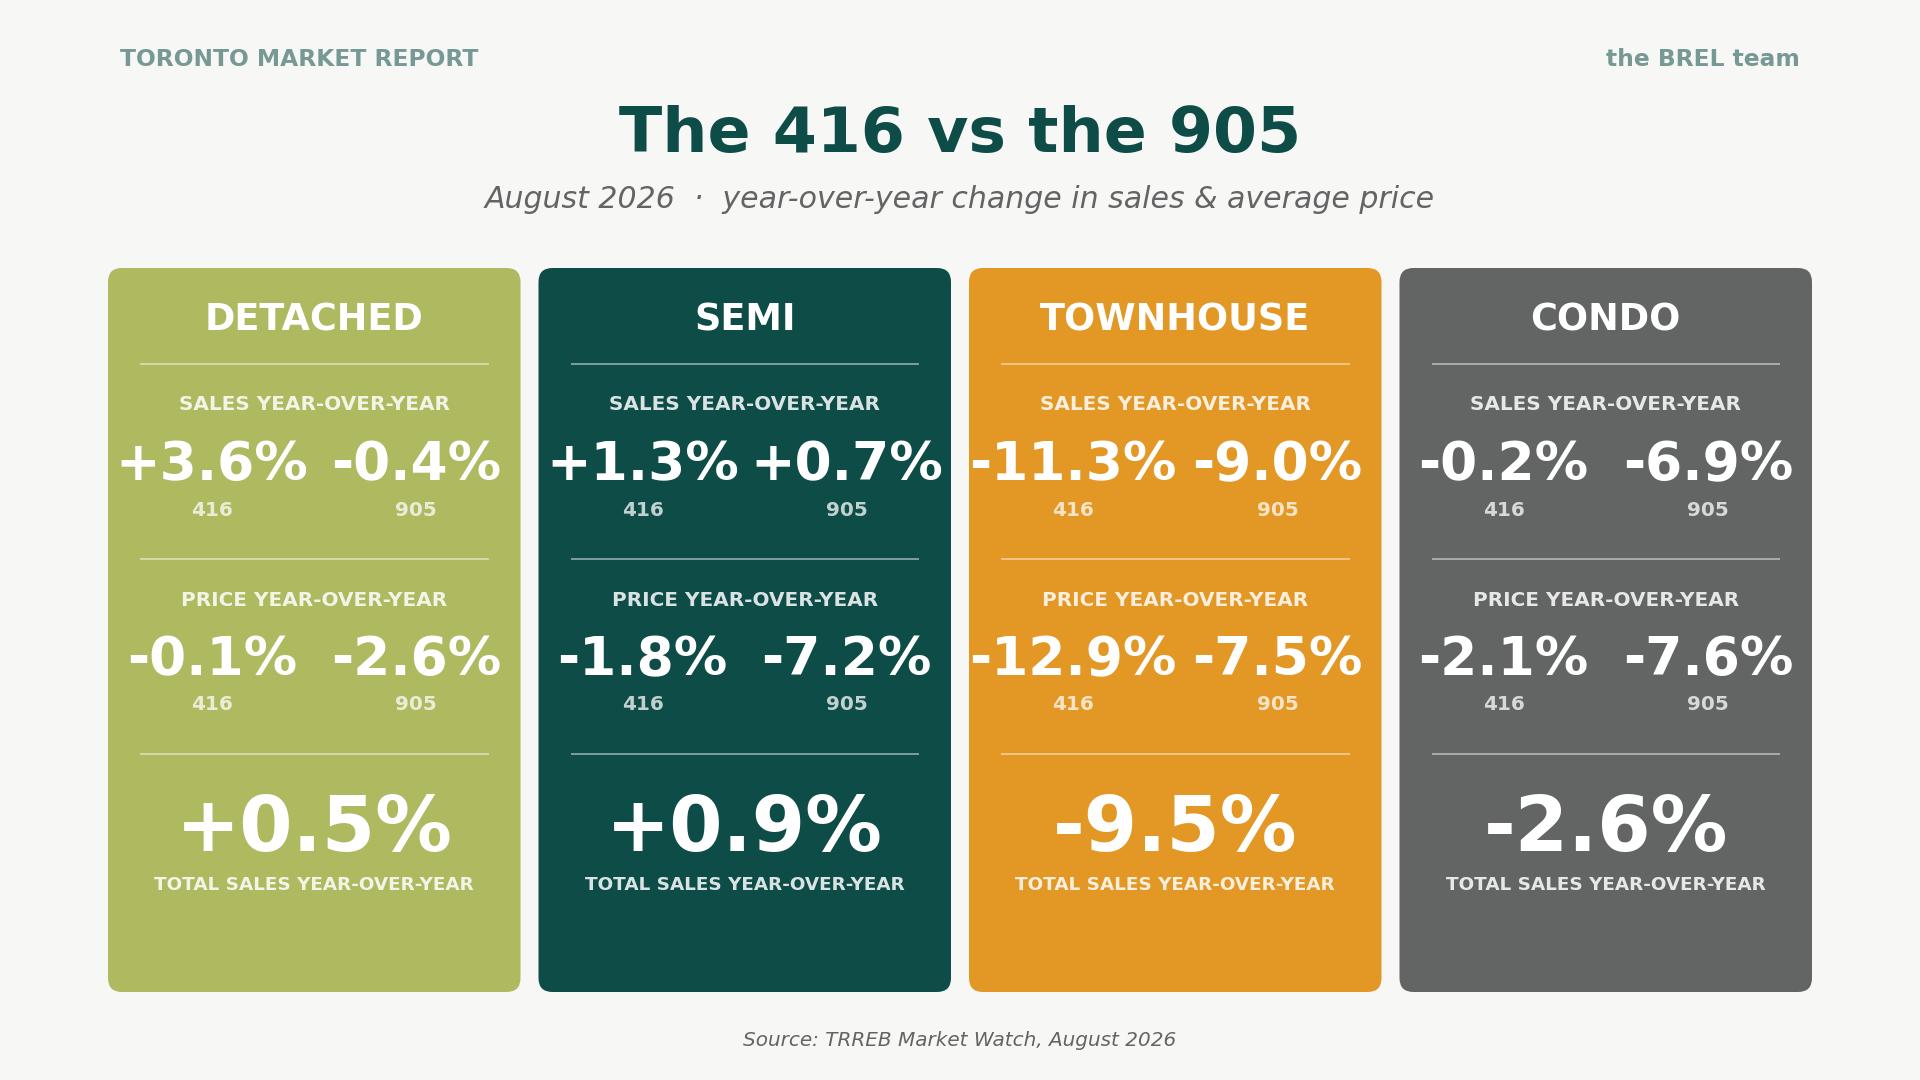
For the last few years, our buyers have been asking us the same question: “Have prices stopped falling in Toronto?” That was the right question for a while, but it’s not the right question this fall.
The Toronto Regional Real Estate Board (TRREB) released the August stats and they tell a story of prices continuing to drift sideways. But when we look at the stats in the context of what’s happening with interest rates, it gets a lot more interesting. The Bank of Canada held its rate on September 2 and used the word inflation more than the word growth. Long-term bond yields are up. Fixed mortgage rates follow those yields almost point for point, and they have started to climb.
If you’ve been waiting for prices to drop another few percent before buying, you now need to weigh that against what’s happening with the cost of borrowing money.
The August 2026 Market: Big Picture
The short version: 5,057 sales, an average price of $993,410, and a benchmark home down 4.46% from a year ago. A typical listing took 51 days to sell once you count relistings, and sold for 97% of what the seller asked. There are 4.6 months of inventory, which is still balanced territory, still tilted slightly toward buyers.
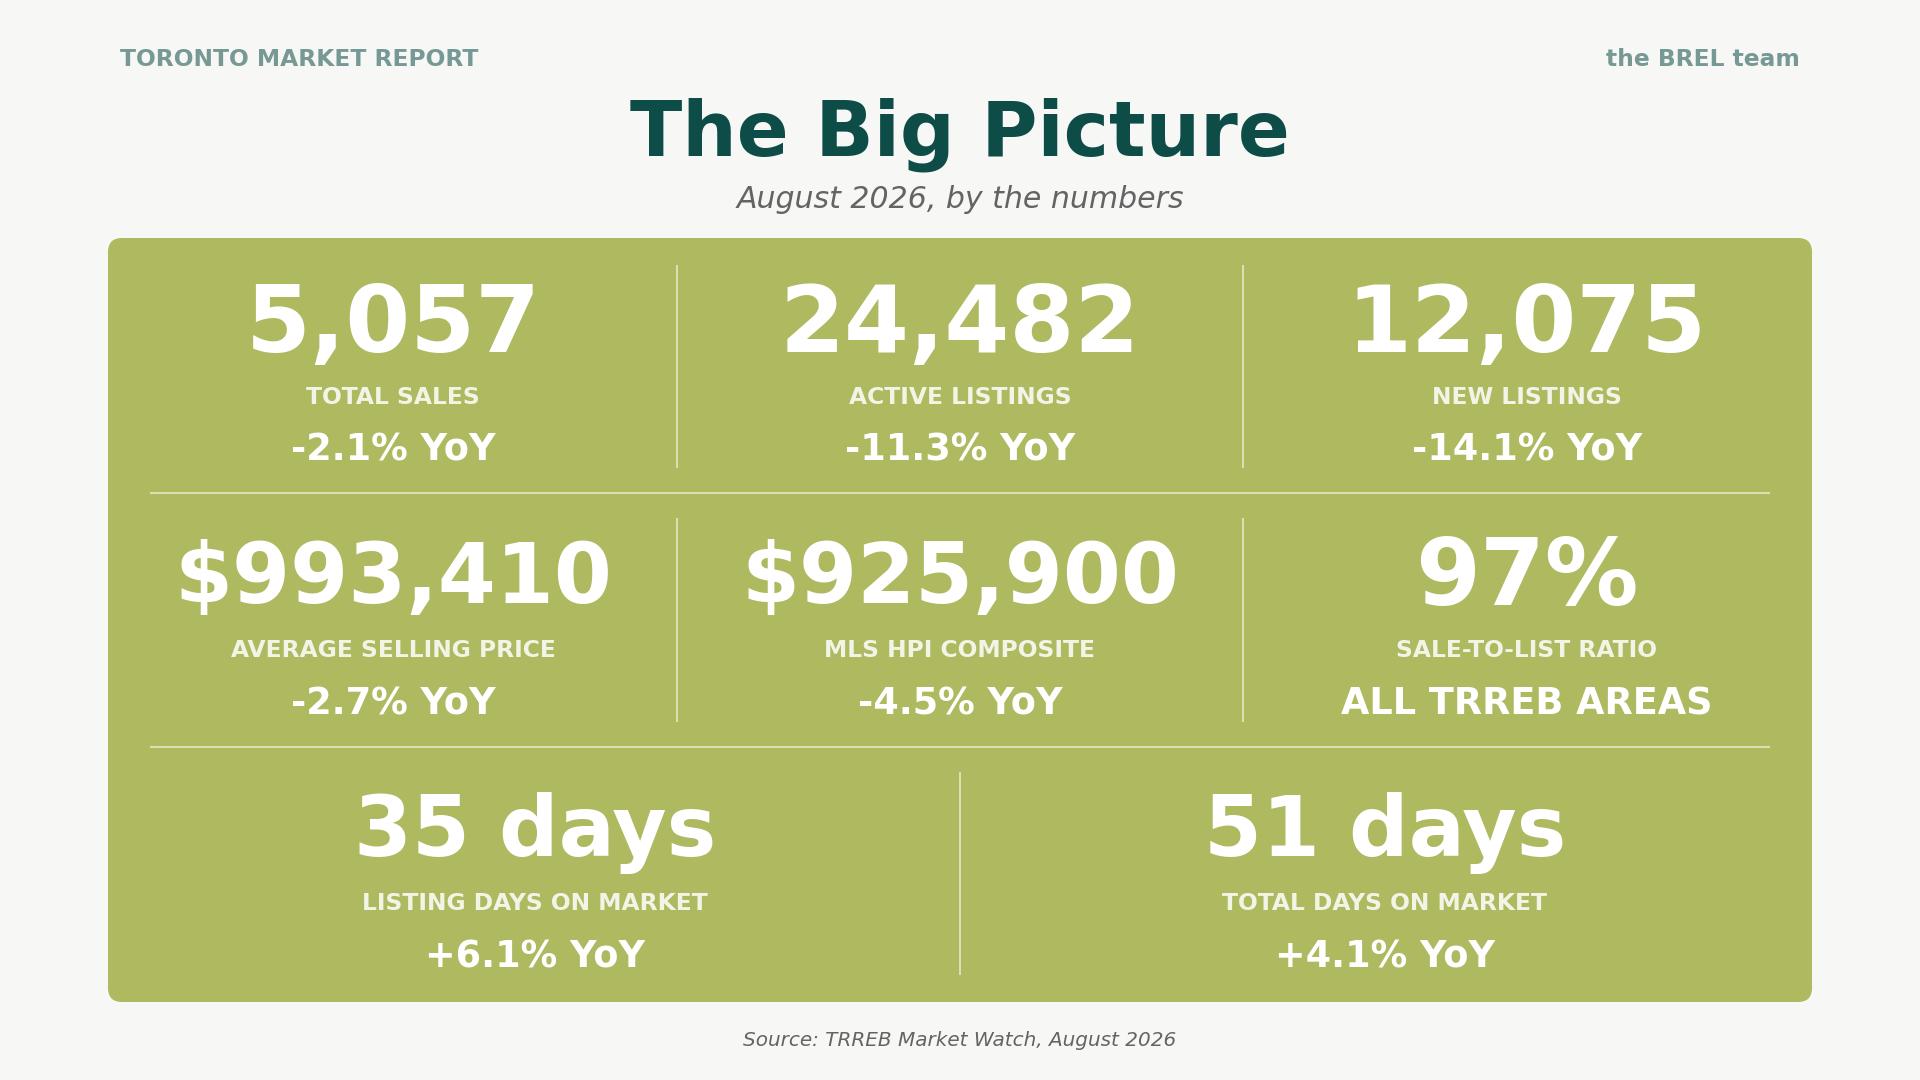
Five Things to Know About the August 2026 Stats
1. Waiting is no longer free
For most of the past two years, a buyer who waited got a better price and, eventually, a better rate. That trade has broken.
The Bank of Canada held the overnight rate at 2.25% on September 2 and doesn’t meet again until October 28. But with July GDP up, the unemployment rate down, bond yields up globally and the inflation risk from the tariffs, we’re not likely to see a cut anytime soon. In fact, we’ve already seen fixed rates starting to climb. If your plan for affordability this fall was cheaper money showing up, you need a different plan.
Pro Tip: Hold a rate rather than hope for one. Talk to you mortgage broker.
2. Fewer homes for sale, but also fewer sales
New listings fell 14.1% and active listings 11.3%, the second straight month of double-digit supply declines. That is a genuine change, and it is why TRREB is now talking about the possibility of renewed price growth.
But…and this is important: Sales fell 2.1% over the same period, so both sides of the market contracted at once. Homes took longer to sell (51 days on average. And on a seasonally adjusted basis, new listings actually rose from July while sales edged down, which is the opposite of the annual trend.
3. Every headline this week: Average price is now under $1 million
The average selling price came in at $993,410, below $1 million for only the second time this year and only the second time in five years.
The problem with this stat is it that doesn’t really tell us much when you dig a little deeper. While the average price of a home in Toronto was down 2.7% in August, the benchmark (which control for what actually sold) is down 4.5%, meaning that the mix of homes sold moved upmarket in August. More houses and fewer condos in the mix lifts the average and tells you nothing about what your place is worth.
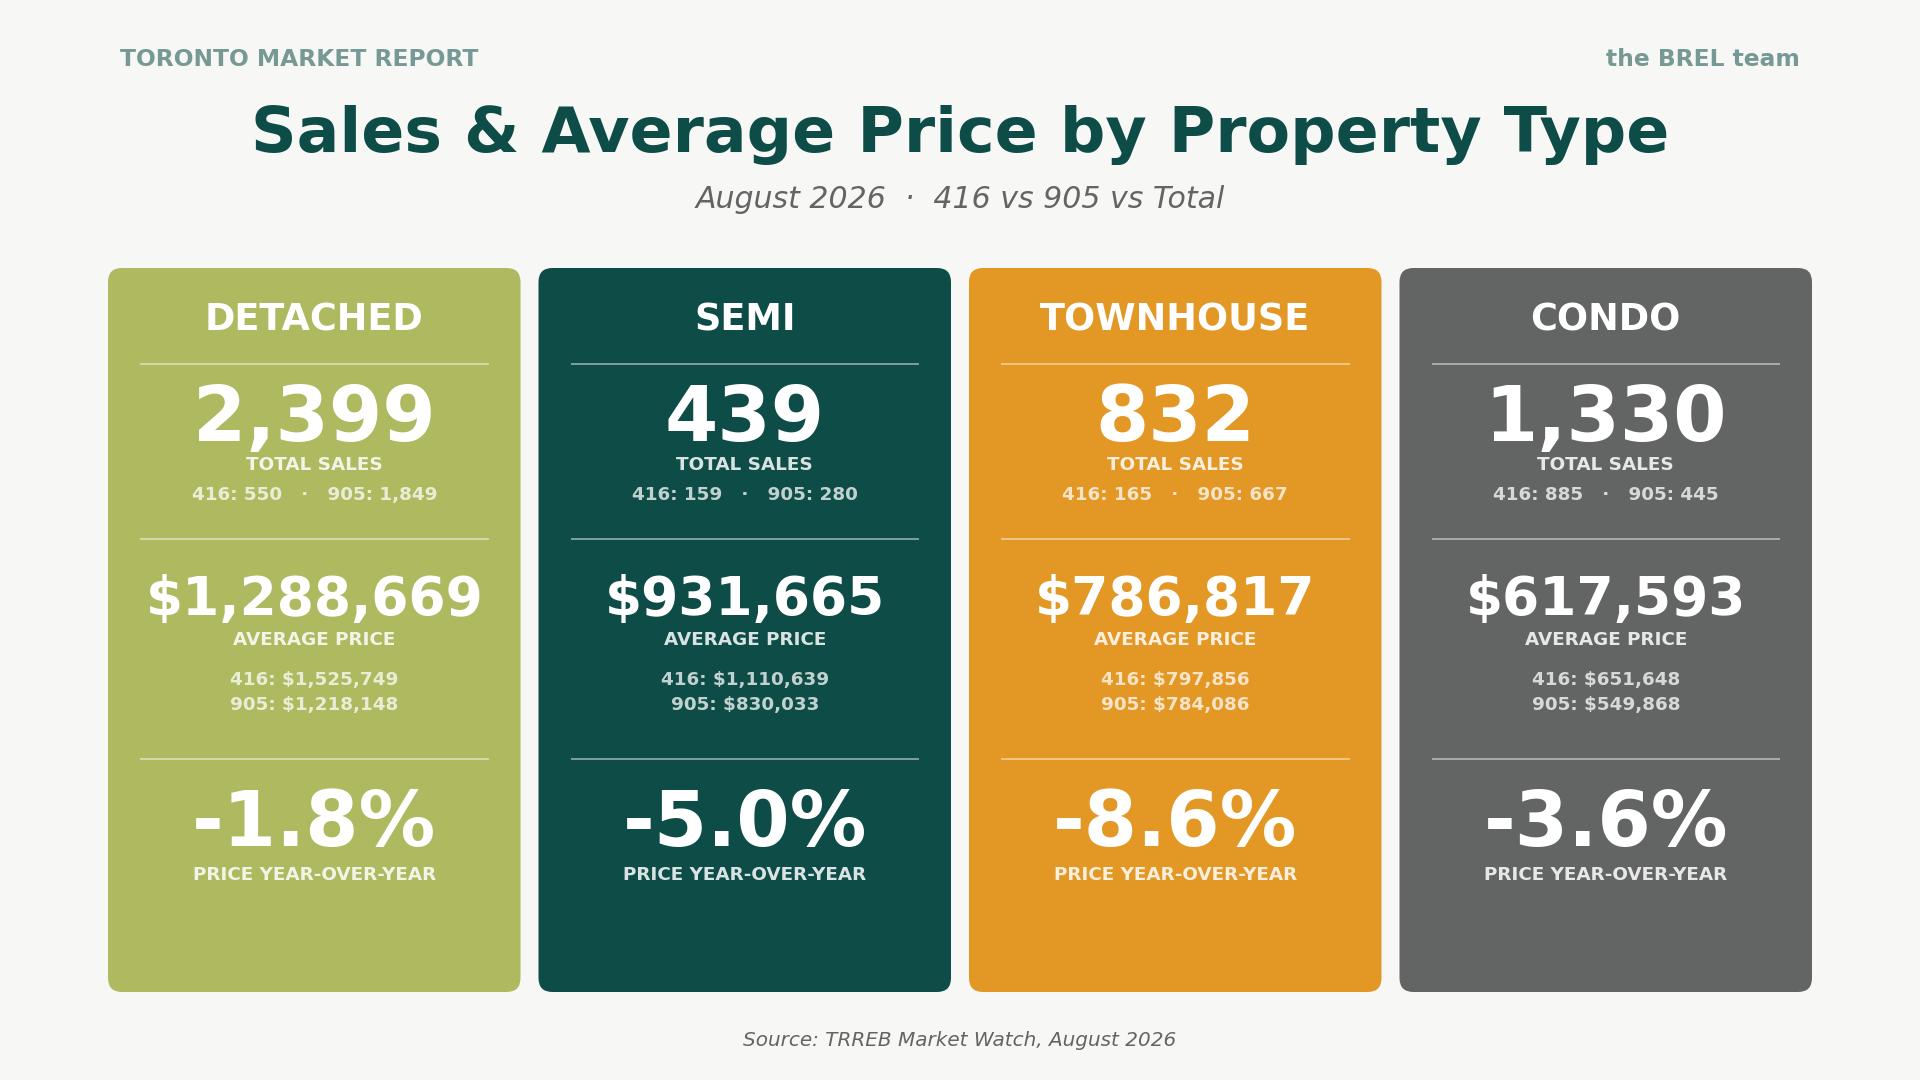
4. The west end finally took the lead from the east end
The east end has spent most of this year as the tightest, fastest, most competitive part of the city, and the west end has been where the deals were. In August that reversed.
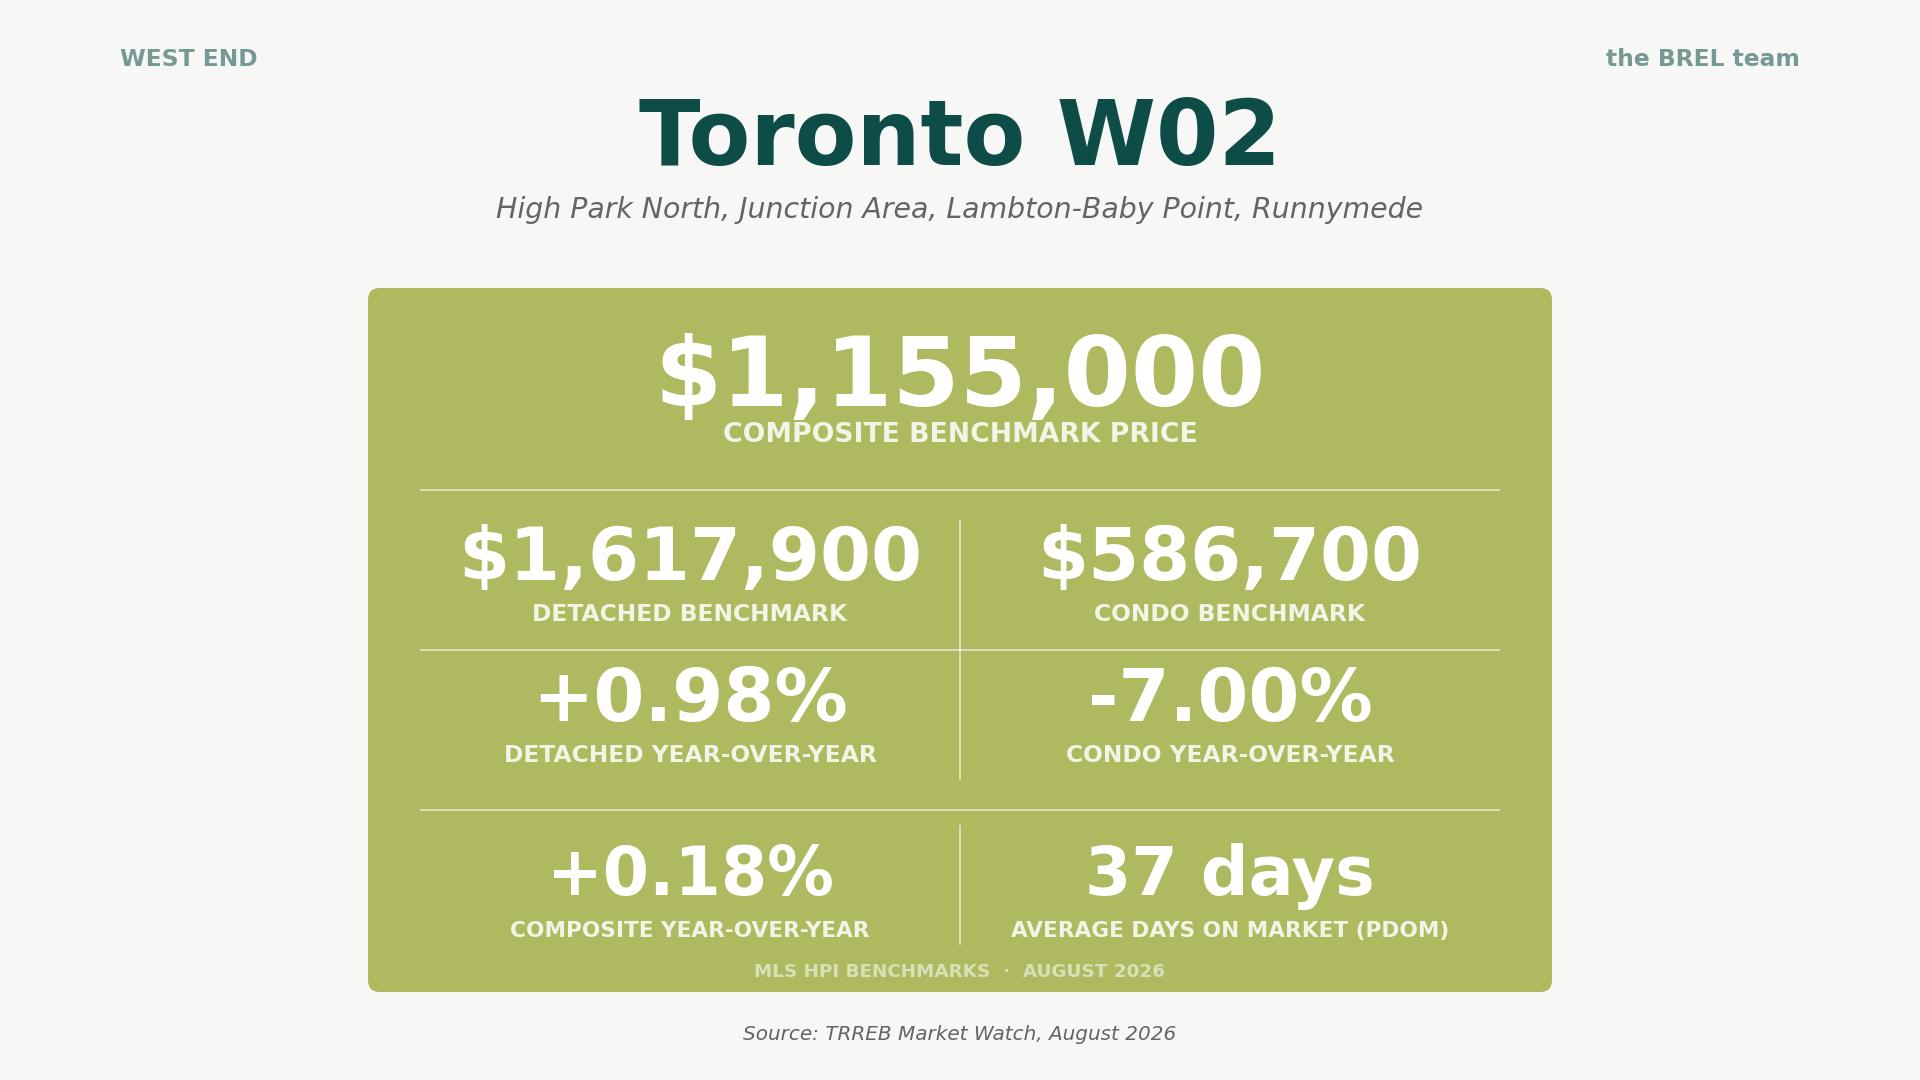
W02, which is High Park North, the Junction, Lambton-Baby Point and Runnymede, posted the only positive composite benchmark among the nine districts we follow, up 0.18%, and the only positive detached benchmark, up 0.98%.
These are small districts and a handful of sales moves them, so treat one month as a signal rather than a verdict. But the direction is consistent across benchmarks, sale-to-list and pace at the same time, and it matches something we have been watching for a while: buyers priced out of Leslieville and the Beaches keep working west, and the Junction is where a lot of them land.
5. New-build and resale are two different markets at two different prices
This is the most useful thing in the data this month and it is not in the TRREB report at all.
A brand new condominium apartment in the GTA carried a benchmark price of $1,054,938 in July, (up 2.5%) while a resale condo in Toronto carried a benchmark of $547,400 in August (down 6.88%). Those are different methodologies and not a perfect comparison, but nothing about methodology explains a gap of over $500,000!
New condo pricing has barely moved because a builder who cuts price blows up their financials and the contracts of everyone who already bought. Resale pricing moved because it can.
In August, we saw the HST rebate significantly increase the sales of pre-constructcion single-family houses, but it didn’t have much of an effect on new condo sales. In fact, new condo sales are still 80% below the ten-year average. That’s partly because of the $500,000 gap between the price of a new condo vs a resale condo; it’s also because the timelines of the HST rebate program don’t really line up with the typical timelines to build condo towers.
What this means practically: if you are buying a new house in the GTA under $1.5 million and living in it, this program is the best thing to happen to your budget in a decade, and the window shuts on agreements after March 31, 2027. If you are considering a pre-construction condo, do the comparison honestly against resale, and satisfy yourself on the construction timeline before the rebate factors into your decision at all.
Neighbourhood Prices: What the HPI Data Tells Us
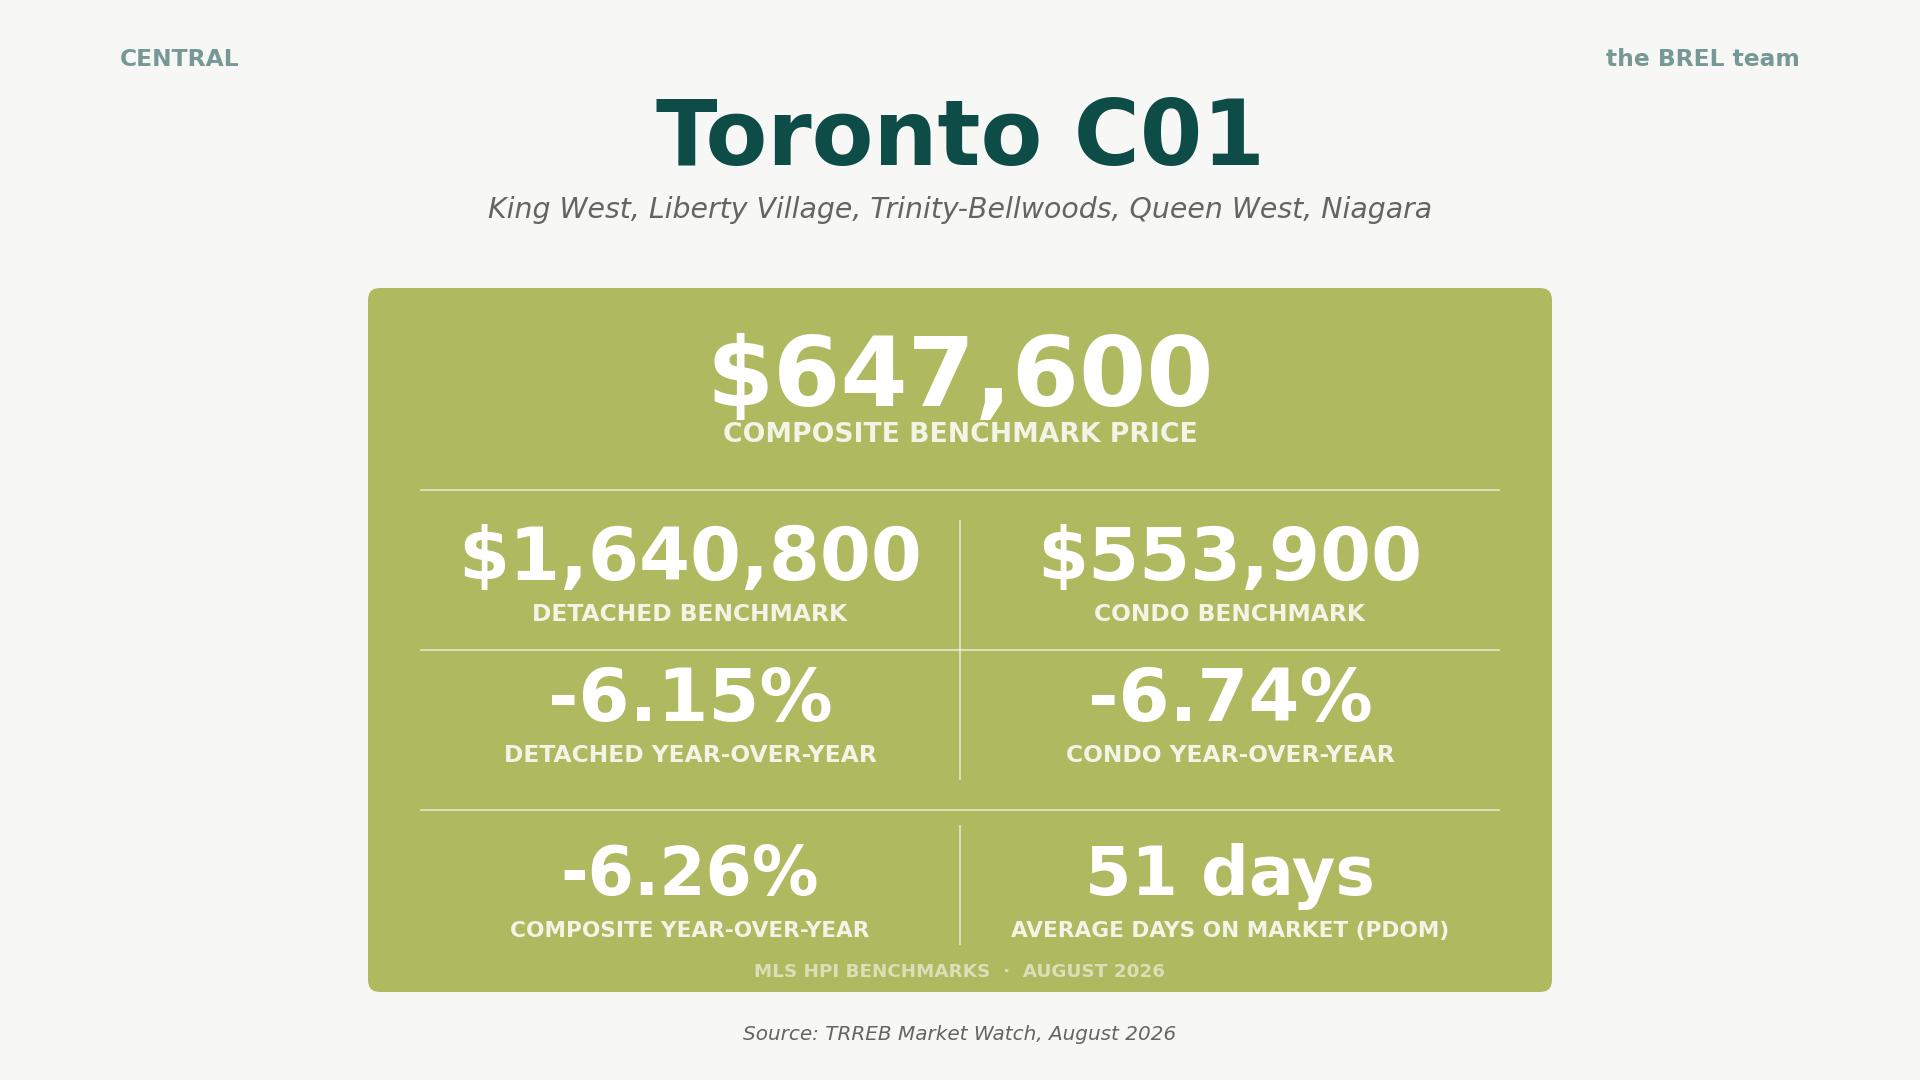
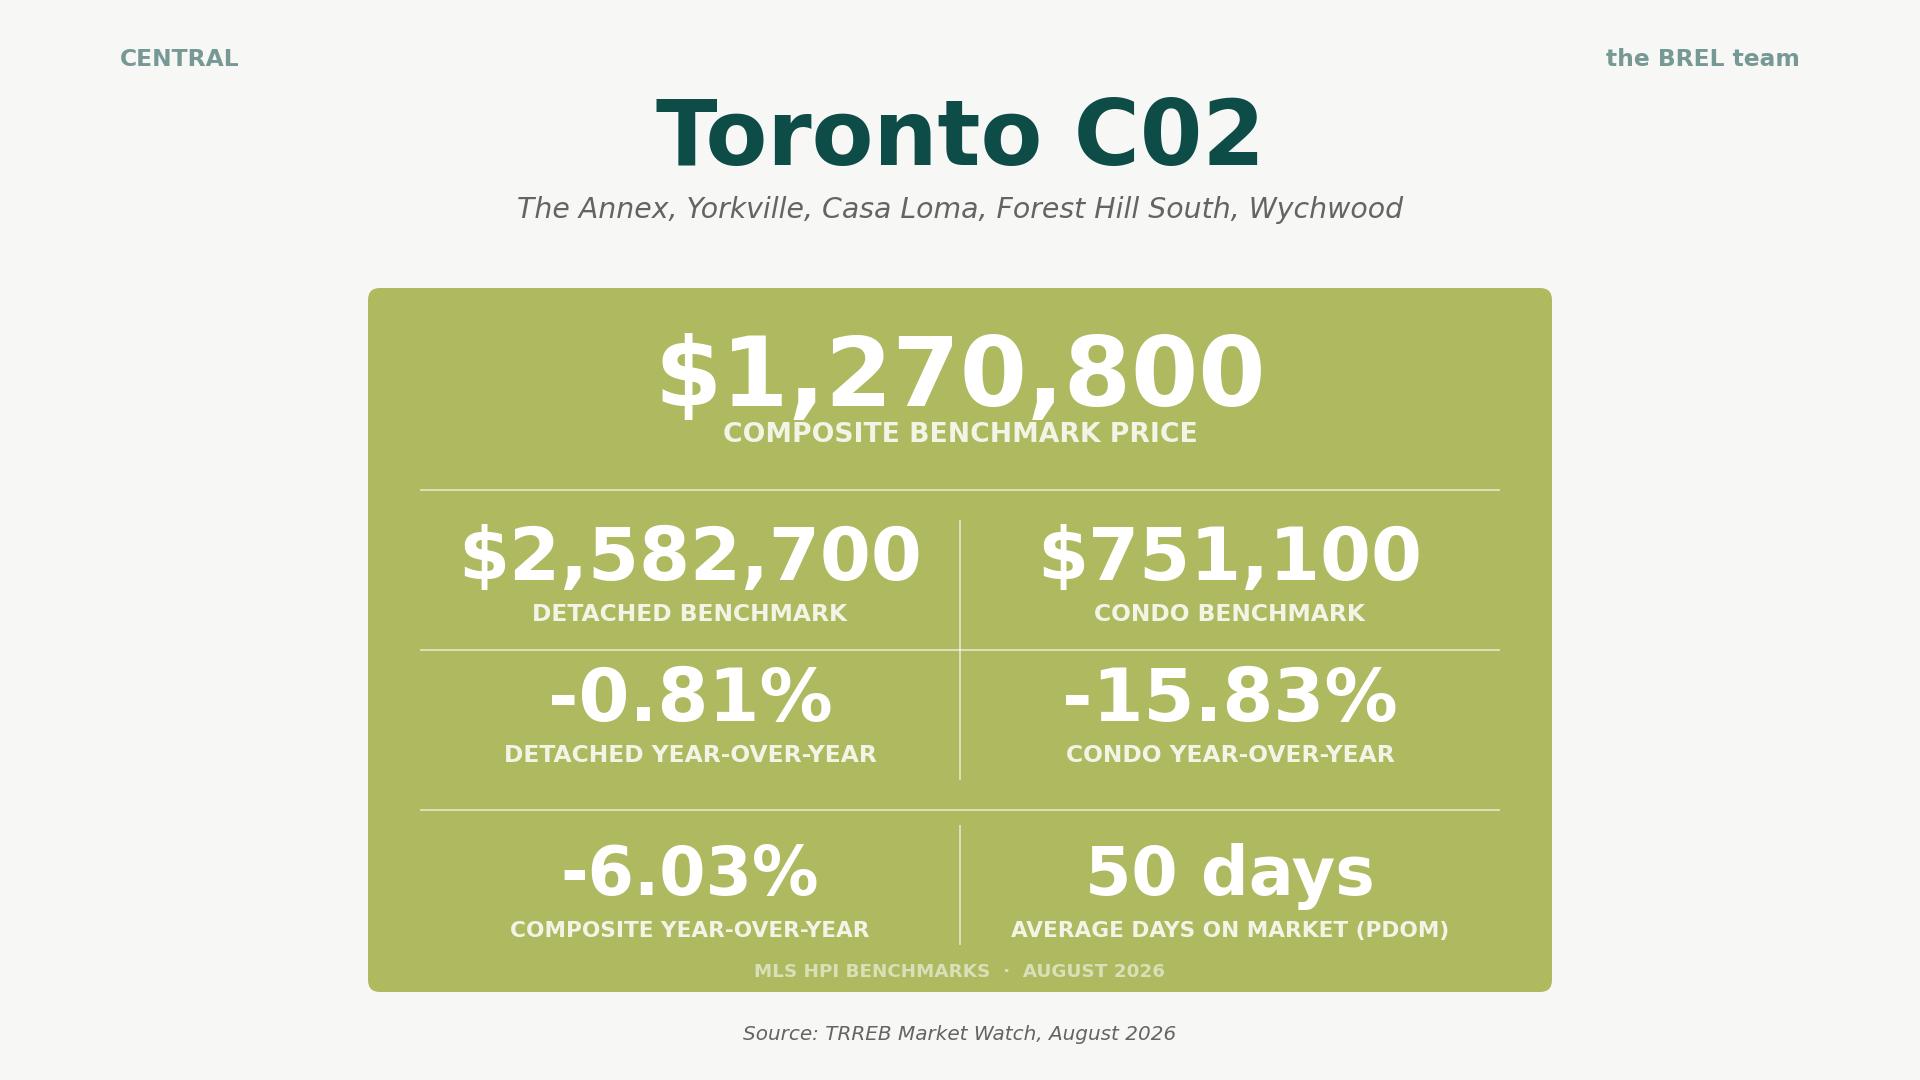
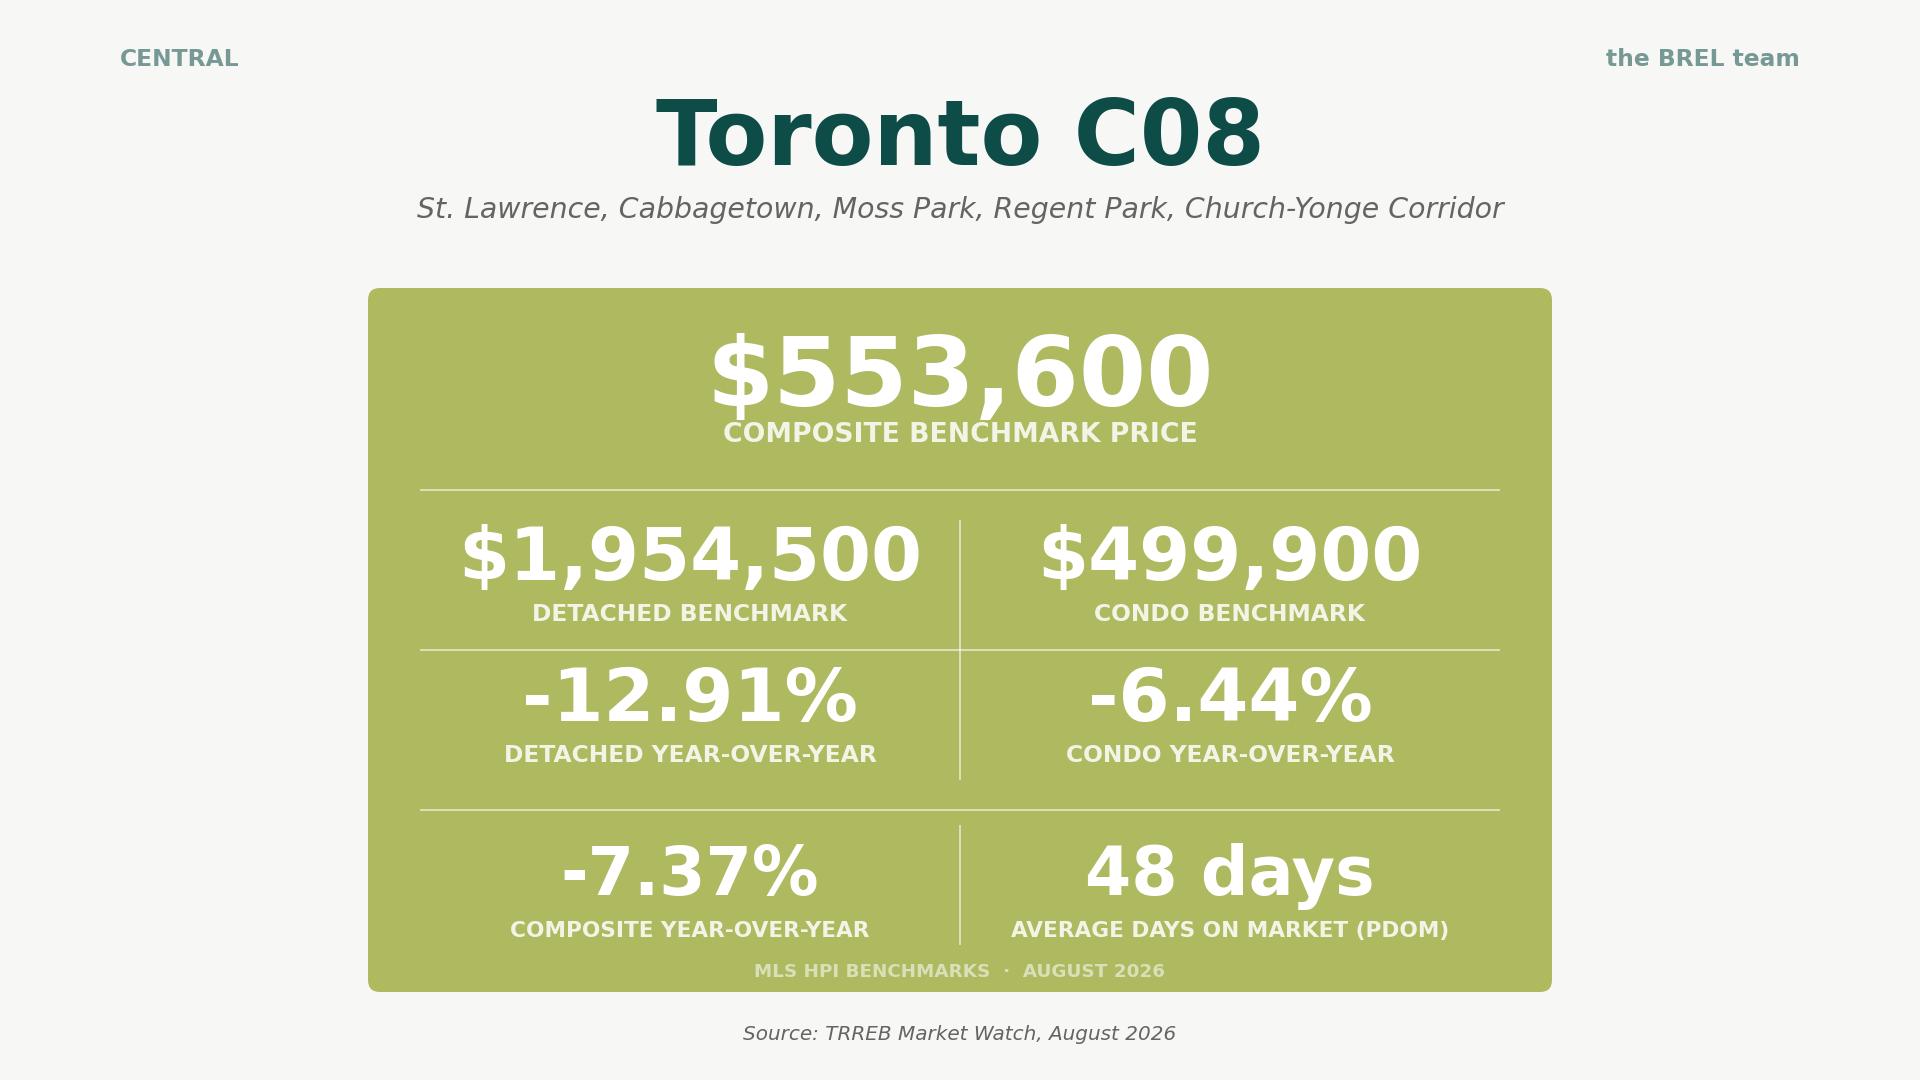
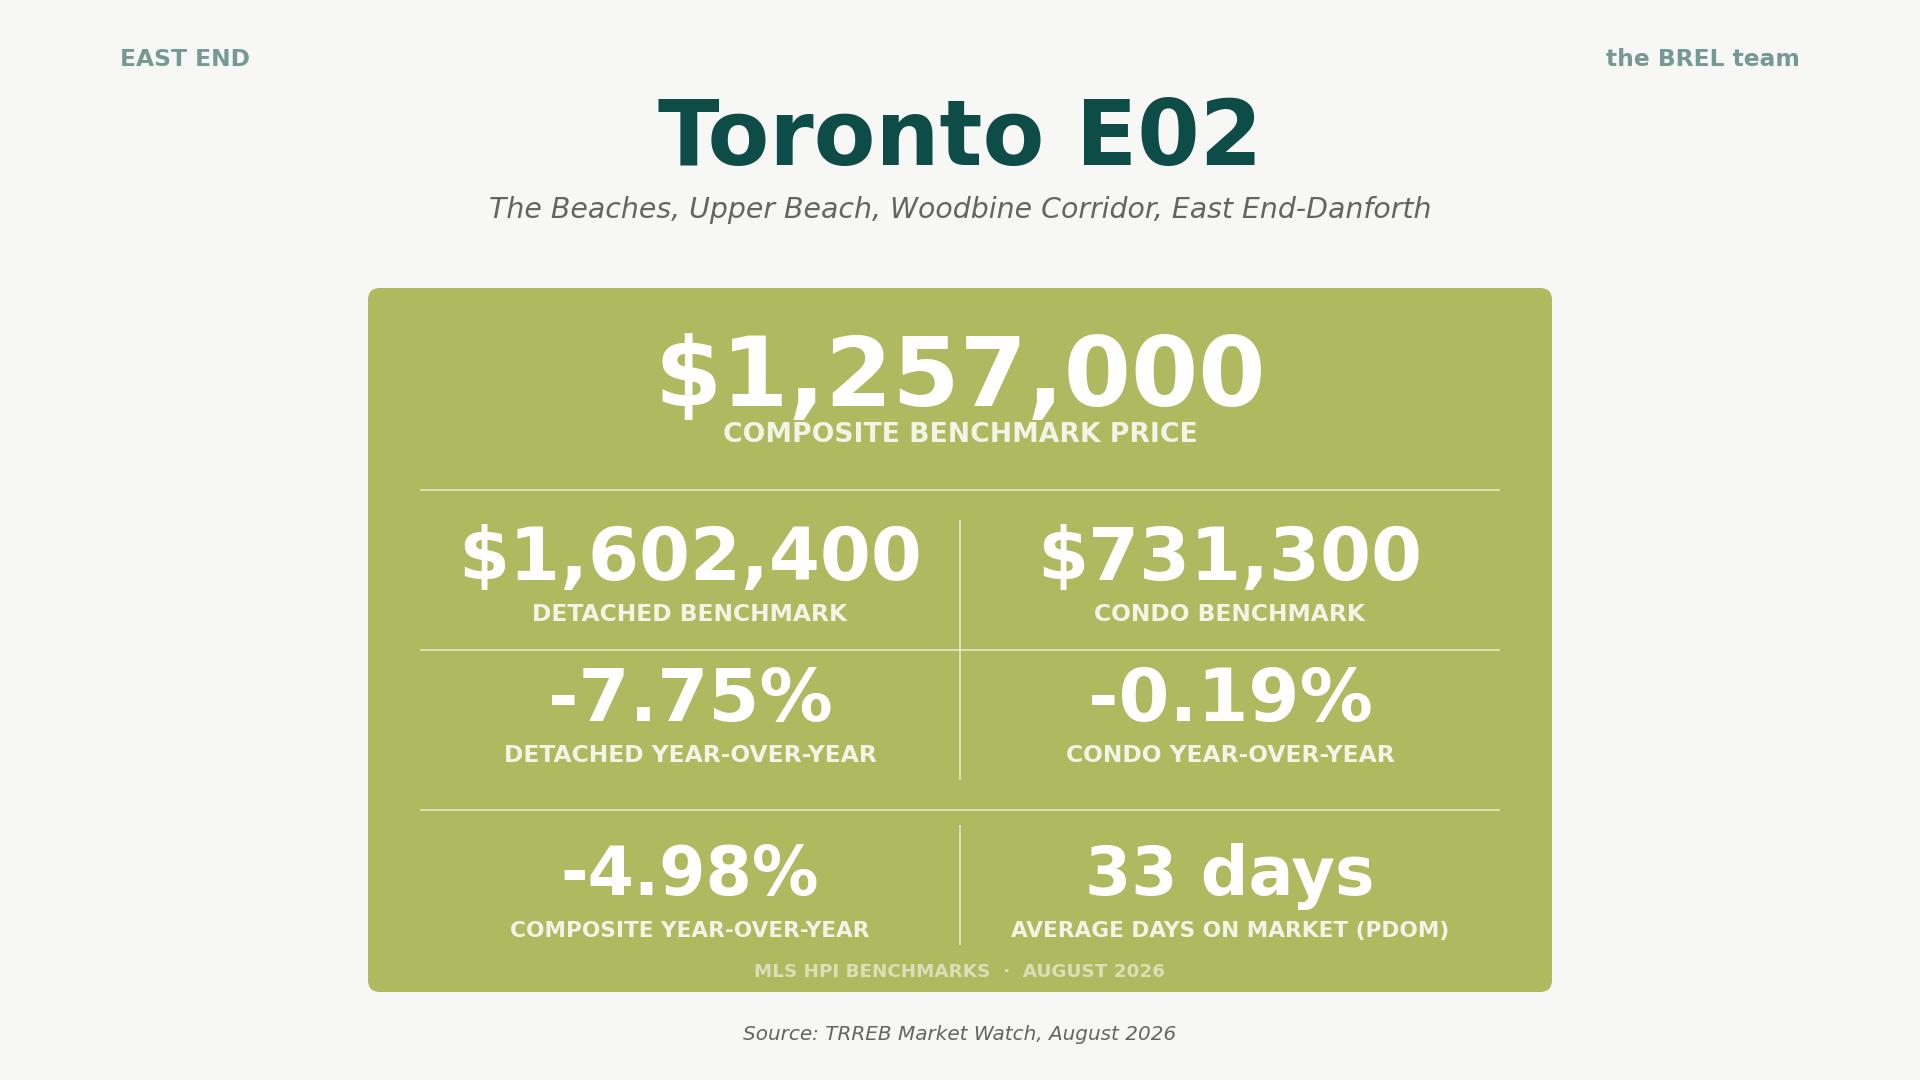
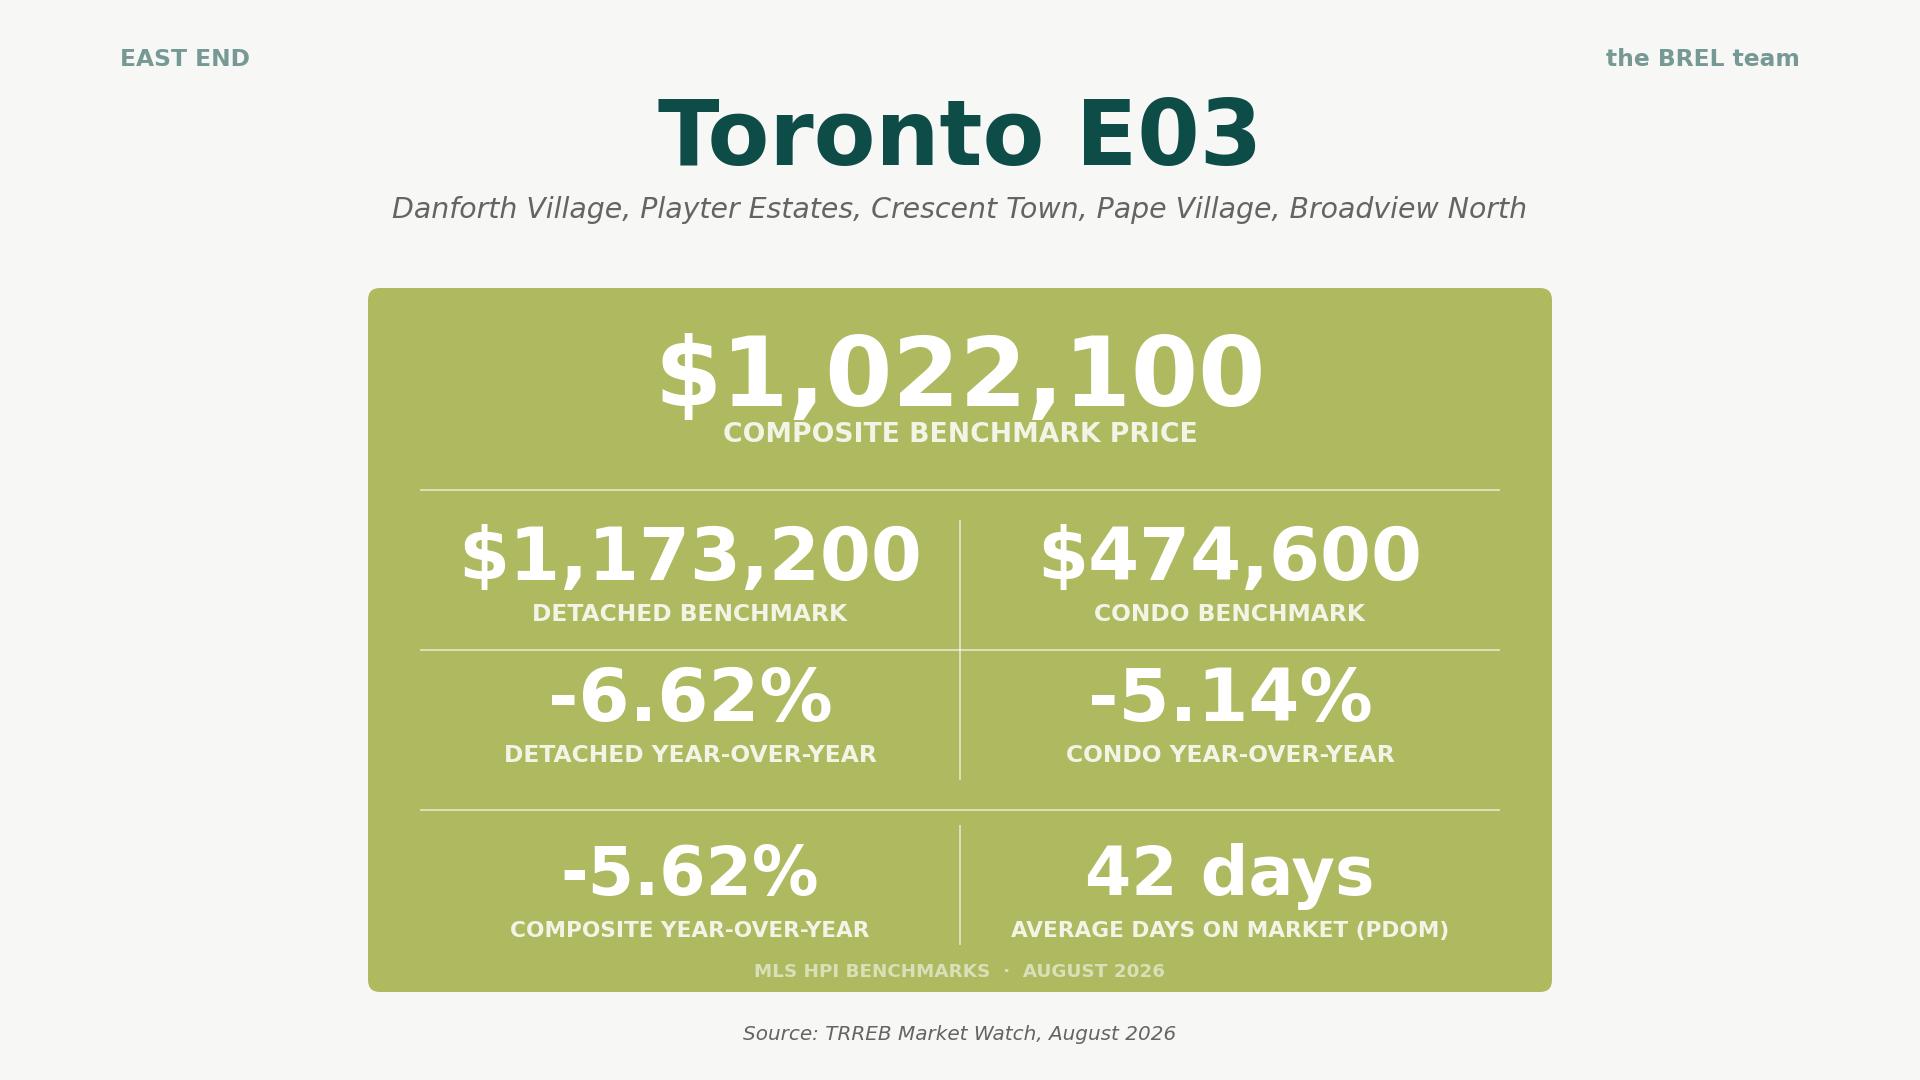
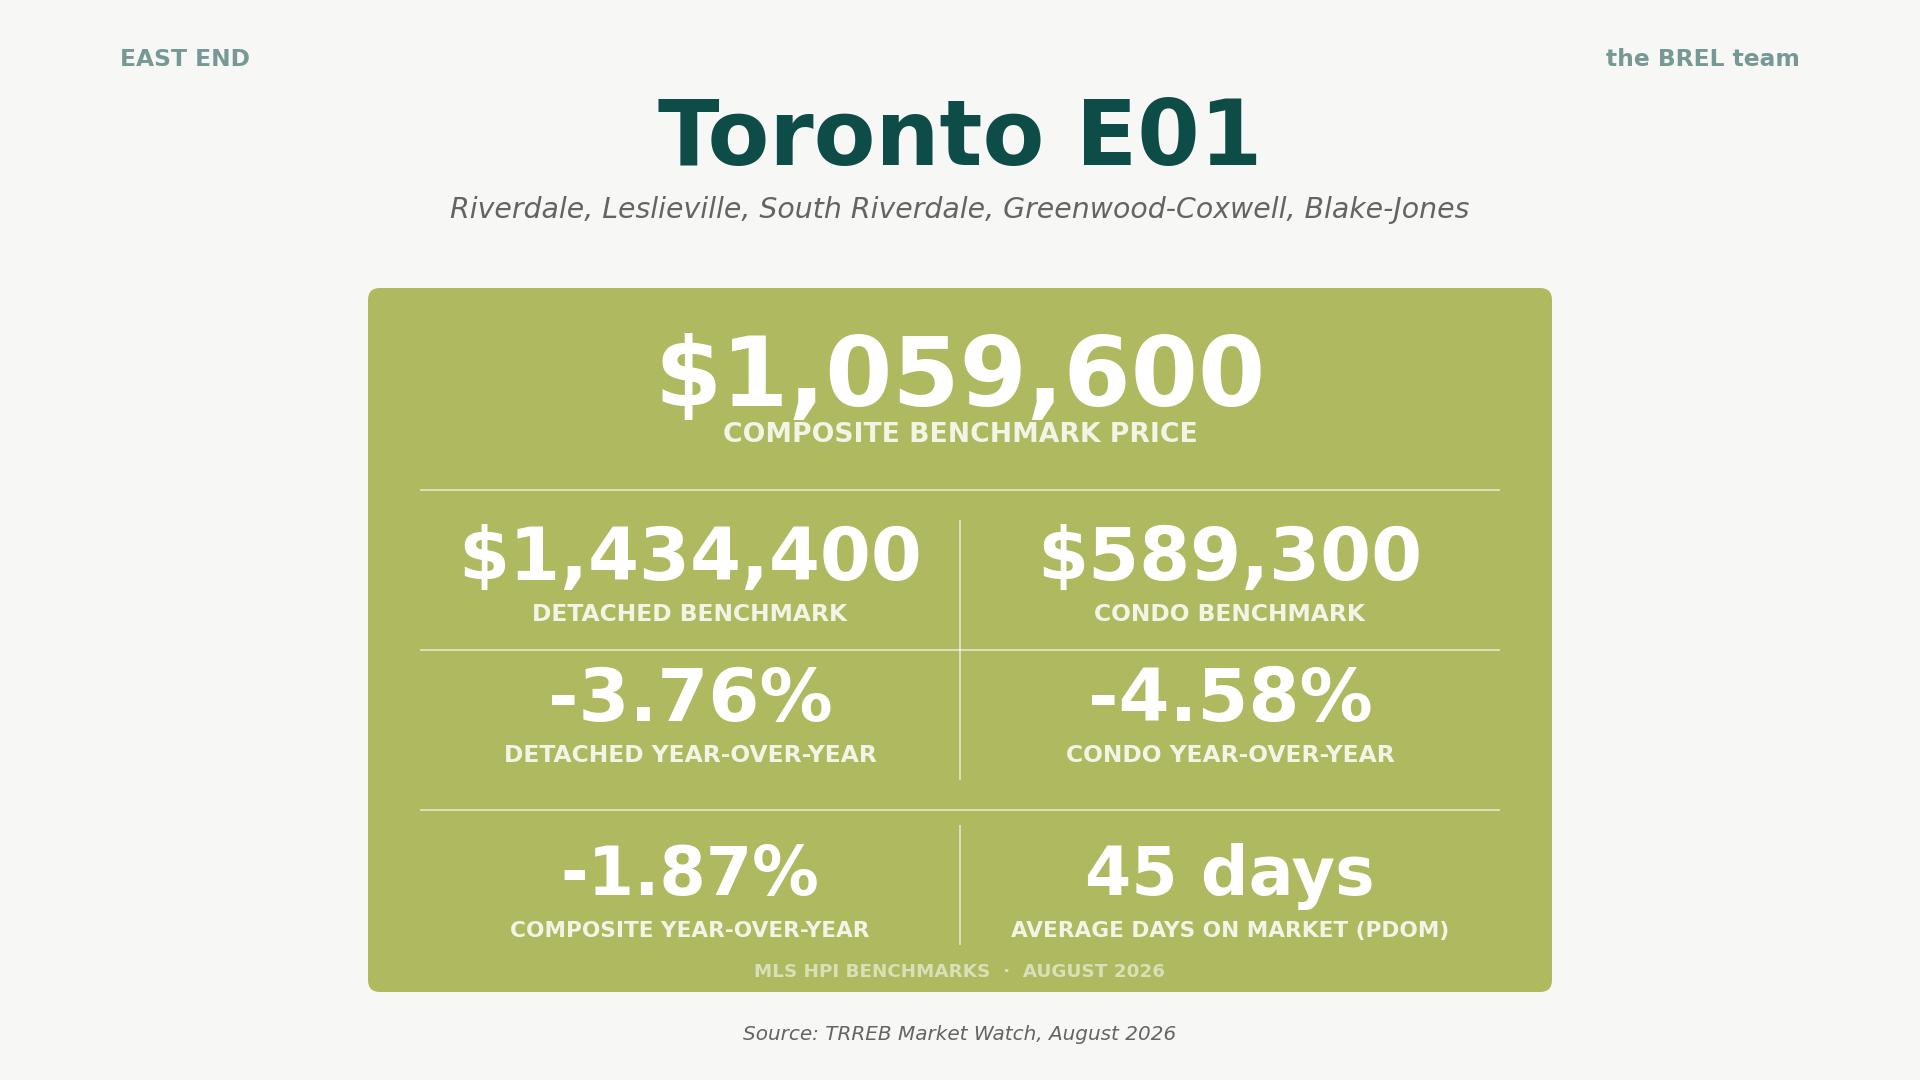
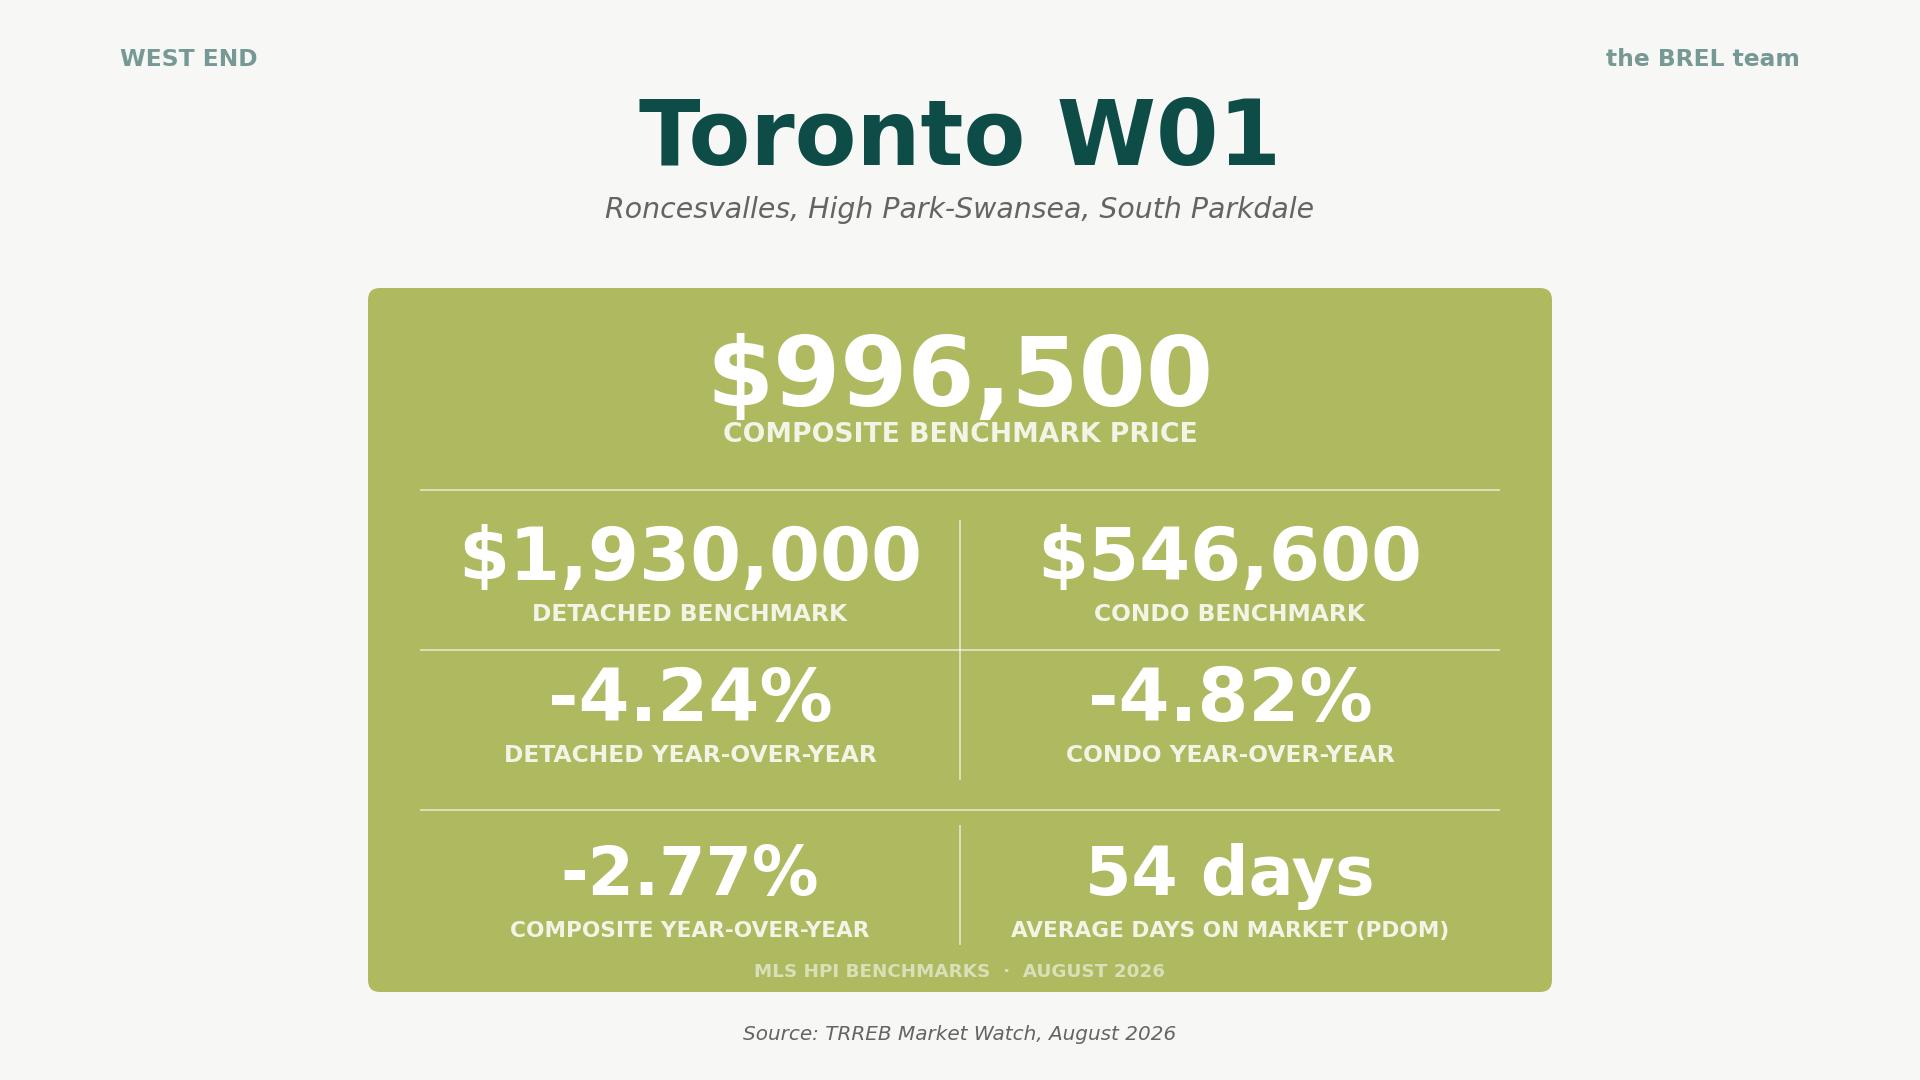
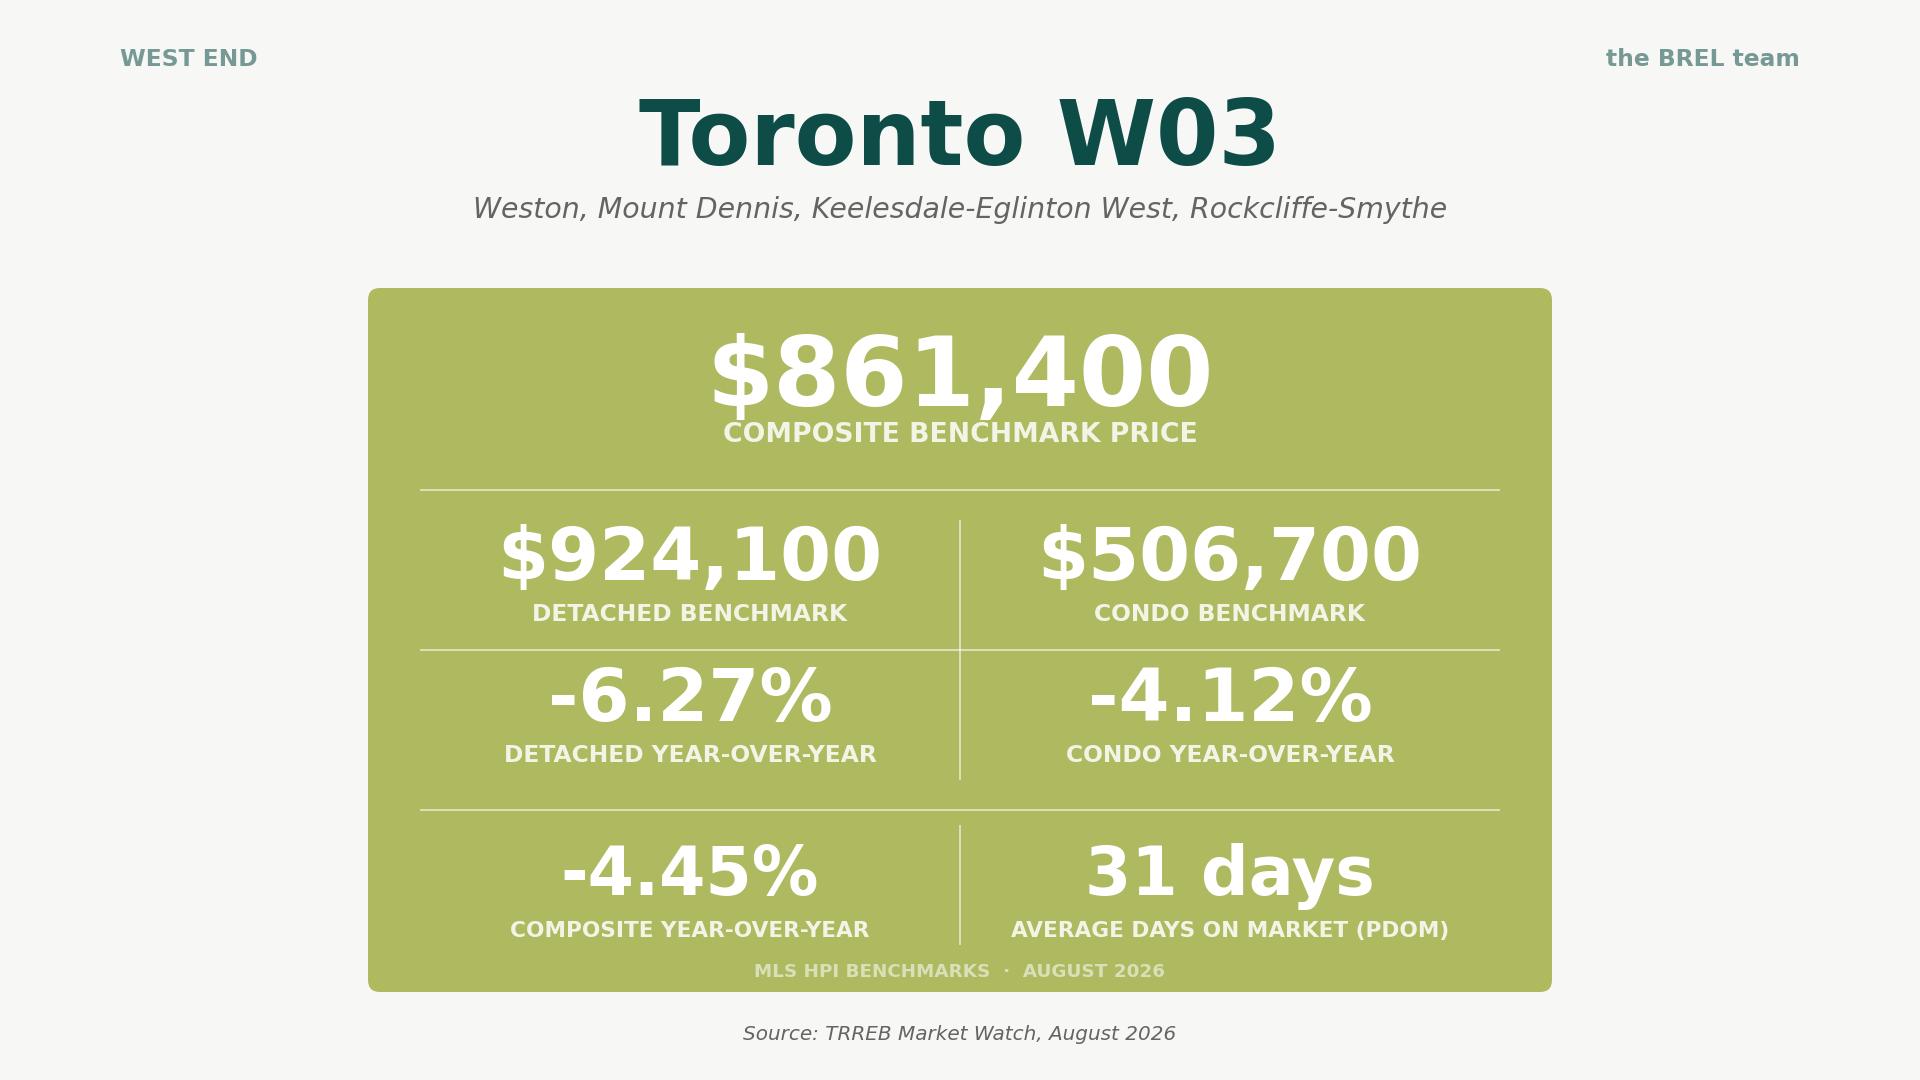
Why we use the HPI rather than average prices when looking at neighbourhood data: An average tells you what happened to sell in a district that month, so in a neighbourhood with forty sales, two big houses can swing it by six figures and mean nothing. The MLS Home Price Index tracks a benchmark typical home over time and strips out that noise. Below are August benchmarks and their annual change.
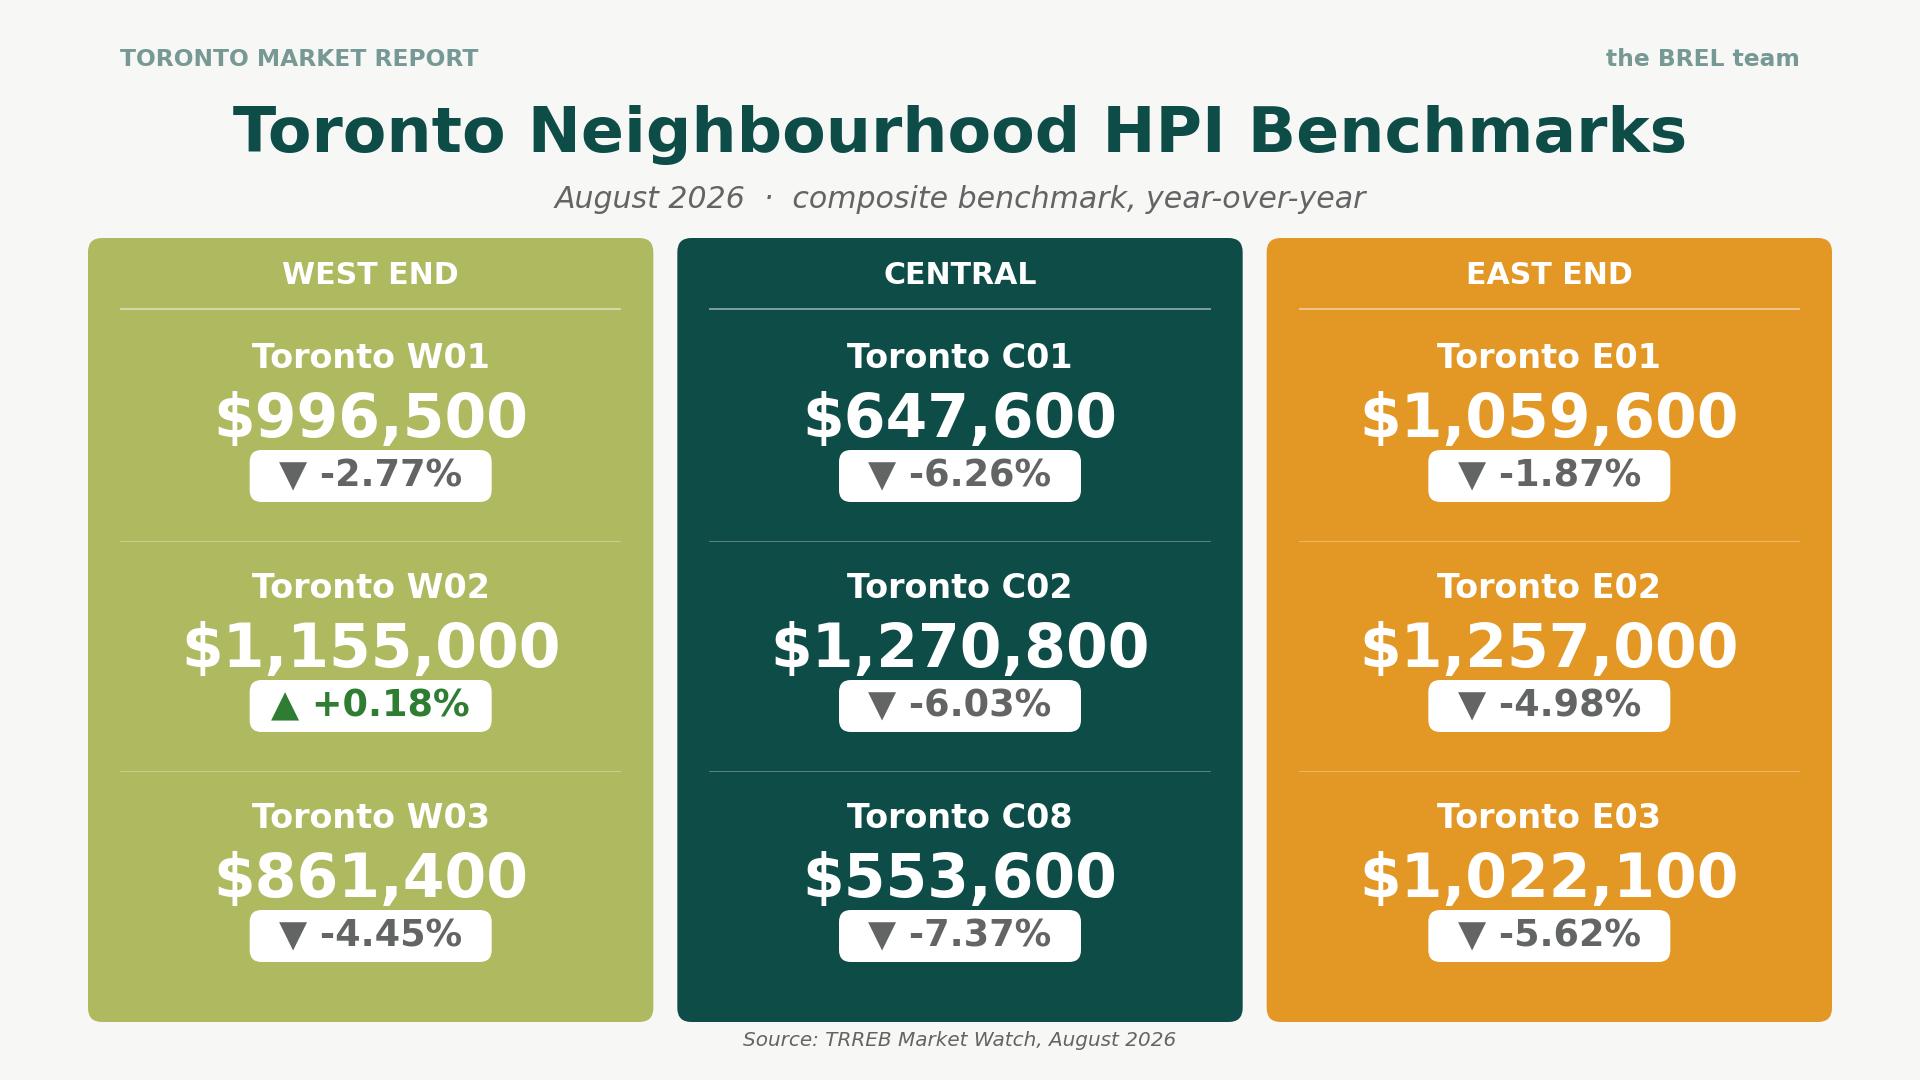
Here’s what happened more specifically across Toronto’s central neighbourhoods:
Central Toronto
East End Toronto
West End Toronto
What Else You Need to Know
Rental vacancy is the highest since the pandemic
Vacancy across the Greater Toronto and Hamilton Area rental apartment market hit 5.4% in the first quarter of 2026, more than double the 2.6% of two years earlier, with the availability rate at a record 8%. Net rents were down 3.8% too.
Toronto’s job market is lagging the country’s
Toronto’s unemployment rate sat at 6.8% in July, higher than Canada’s 6.4% rate. A city whose labour market is trailing the country’s is a city whose housing demand recovers in fits rather than all at once, and with Ontario carrying the most exposure to the tariff file, that gap is worth watching more closely than any single month of sales.
Advice for Toronto Buyers
You still have leverage. There’s still lots of inventory, the average home sold below asking and it typically took 51 days for a home to sell. That hasn’t changed.
What has changed is the clock. The thing that will decide your budget this fall is your interest rate, not another two percent off the price. Get the pre-approval, hold the rate, and run your numbers on today’s cost of money rather than a cut that the Bank of Canada has given no sign of delivering.
Pro Tip: Ask for property days on market rather than the listing date, because the 16-day gap between the two across the region is re-listing, and a home on its third listing is telling you something.
Advice for Toronto Sellers
The good news: you have less competition. New listings are down 14.1% and active listings down 11.3%, so there are fewer rival homes in front of your buyer than a year ago.
BUT: Sales fell too, so the buyer pool didn’t grow. Days on market went up, not down. The average home still sold below asking. And seasonally adjusted new listings rose from July, which suggests some of your competition is already on its way back.
Presentation, staging and a realistic price are still the entire toolkit.