— We take our content seriously. This article was written by a real person at BREL.
January market stats always come with baggage.
It’s the slowest month of the year, weather distorts behaviour, and year-over-year comparisons can make things look either scarier or better than they really are. Still, January sets the tone, and this one quietly says more about where the Toronto market is heading than the headlines suggest.
Yes, sales were down 19.3%. Yes, prices softened 6.5%. And yet, interest rates are lower, unemployment improved, and affordability is better than it’s been in years. So where are all the buyers?
Underneath the familiar “the market is slow” story, there are some meaningful shifts that matter whether you’re buying, selling, or just keeping an eye on your biggest asset. Let’s break down what happened and what matters:
The Big Picture: January 2026 by the Numbers
According to the Toronto Regional Real Estate Board (TRREB):
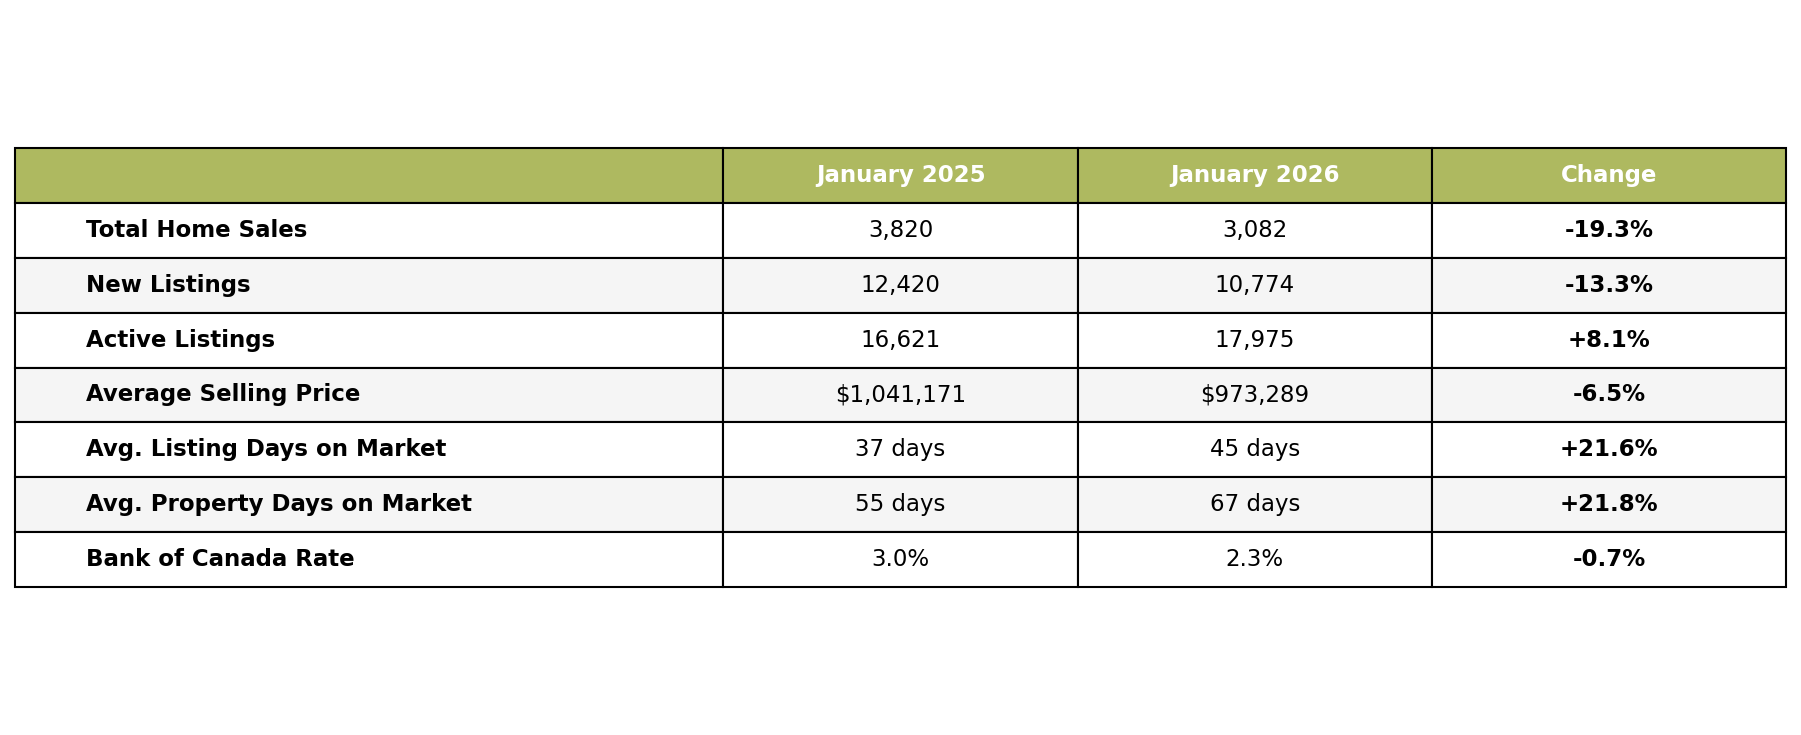
If you’re just skimming the headlines, it looks grim. But the real story is in what these numbers reveal about buyer and seller psychology right now.
Five Things to Know About the January 2026 Stats
1. The Hidden Relisting Problem
Here’s a stat most people gloss over: the gap between Listing Days on Market (LDOM) and Property Days on Market (PDOM).
LDOM (Listing Days on Market): How long the current listing has been active – the number you typically see advertised.
PDOM (Property Days on Market): How long the property has actually been for sale, including any previous listings that expired or were terminated – the total number of days it was actually listed for sale.
In January, LDOM was 45 days. PDOM was 67 days. That 22-day gap tells you something important: a significant number of homes are being listed, failing to sell, and getting relisted.
That “45 days on market” you see on a listing? It might actually be the property’s second or third attempt. The real time on market before selling is about 49% longer than what agents typically advertise. This matters if you’re a buyer (more negotiating room) and if you’re a seller (pricing strategy is everything).
2. It’s a Confidence Problem, Not an Affordability Problem
The Bank of Canada dropped rates from 3.0% to 2.3% over the past year. Unemployment ticked down from 8.4% to 8.1%. On paper, conditions improved. Yet sales dropped nearly 20% when compared to January 2025.
This isn’t just about affordability anymore….it’s about confidence. Buyers are watching tariff threats, job market uncertainty, and wondering if prices have further to fall. Until they feel secure about their income and the economy, lower rates won’t be enough to get them off the fence.
And here’s something that doesn’t fit the typical “buyer’s market” narrative: new listings also dropped 13.3%. Sellers aren’t flooding the market. They’re choosing to wait rather than accept prices they don’t like.
This is restraint, not panic. Both sides are sitting on their hands. And that matters: when volume drops because people are choosing not to act (rather than being forced to sell), price declines tend to be slower and more uneven. We’re not seeing distress…but we are seeing hesitation.
3. January’s Weather Was Historic And It Showed
January 2026 was brutal. Our second big January storm dumped 46 cm of snow (56 cm downtown!) – the highest single-day snowfall. By month’s end, we’d experienced our snowiest January EVER. Schools closed across the GTA. The City declared a Major Snowstorm Condition. People were cross-country skiing down city streets!
Does weather affect real estate? Absolutely. Open houses get cancelled. Showings get postponed. Buyers stay home. You can’t fully disentangle weather from market psychology, but anyone who lived through January knows it wasn’t exactly ideal house-hunting conditions. Some of this month’s softness will bounce back in February and March, assuming spring cooperates and the groundhogs are right.
4. The 416 Continues to Outperform the 905
Detached homes in the 416 saw prices drop just 2.8% year-over-year. In the 905? Down 8.8%. That’s a trend we’ve been watching for the last few years.
The MLS Home Price Index tells the same story: City of Toronto is down 6.62% overall, while Halton (-10%), York (-9.1%), and Durham (-6.9%) are all correcting—with the pricier suburban markets feeling it most.
The suburbs that saw the biggest gains a few years ago are giving more back. Meanwhile, established city neighbourhoods with good transit, walkability, and amenities are proving more resilient. If you’ve been weighing city vs. suburbs, that math has shifted.
5. The “Middle Market” Didn’t Have a Great January
Semi-detached homes and townhouses are supposed to be the sweet spot: more affordable than detached houses and more spacious than condos.
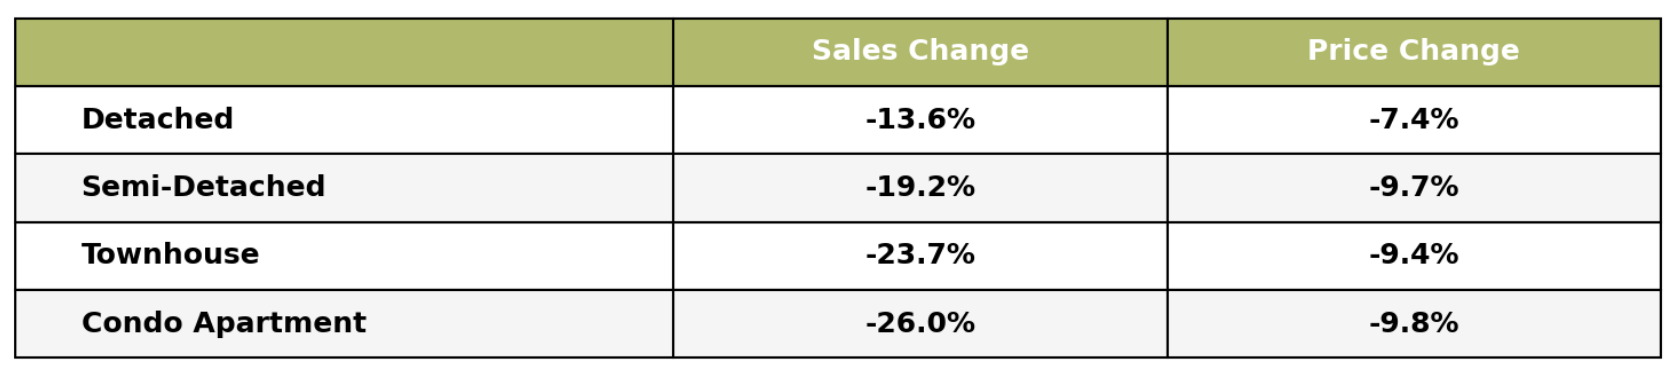
The middle market is squeezed from both sides. First-time buyers who might have stretched for a semi are holding tight in their condos (or rentals). Move-up buyers who’d normally step into this segment are eyeing detached homes instead; the price gap has narrowed enough for many buyers, to make jumping straight to a detached house more attractive.
Neighbourhood Prices: Central, East & West Toronto
This month, we’re taking a deeper dive into Toronto’s central, east and west neighbourhoods. We used the MLS Home Price Index (HPI) rather than average prices to help account for the smaller data sets.
Why use the HPI? Average prices can be misleading. If a neighbourhood happens to sell more starter homes one month and more luxury homes the next, the “average” swings wildly even if actual values haven’t changed. The HPI controls for this by tracking price changes for similar homes over time, giving you a true apples-to-apples comparison.
Toronto West (W01, W02, W03)
The west-end showed some surprising resilience:
W01 (High Park, Roncesvalles, Parkdale): The standout performer in the city. Composite prices down just 1.69%, barely a blip. Detached homes actually increased 4.74%. This established family neighbourhood with strong transit and walkability is proving its staying power. Benchmark price: $1,057,400.
W02 (Junction, Bloor West Village): Down 8.20%, closer to the city average. Still a desirable area, but the correction is hitting harder here than in W01. Benchmark: $1,184,700.
W03 (Rockcliffe-Smythe, Keelesdale): Down 9.58%. This area saw bigger gains during the boom and is giving more back. Still, benchmark prices at $847,600 make it one of the more accessible freehold options in the city.
The takeaway for Toronto West: W01 is the anchor holding value, while W02 and W03 are seeing a bigger correction. If you’re buying in W03, there’s better value than a year ago. If you’re selling in W01, you’re in a stronger position than most.
Toronto Central (C01, C02, C08)
The core tells different stories depending on what you’re buying.
C01 (Downtown Core, Financial District, Entertainment District): The composite is down 3.49%, but that number hides a split market. Detached homes actually increased 0.24% year-over-year, and semis are down just 1.29%. It’s the condo volume and price drops dragging the composite down. If you’re looking at a freehold in C01, the market is tighter than the headlines suggest. Condo benchmark: $676,400. House benchmark: $1,713,700.
C02 (Yorkville, Annex, Summerhill): Down 7.08% on the composite. Unlike C01, detached homes here are feeling it too (down 7.84%), while semis are holding better (down 4.66%). The luxury segment in Yorkville is seeing softer demand. Composite benchmark: $1,305,800.
C08 (Waterfront, St. Lawrence, Corktown): The hardest-hit area we work in, down 11.03% overall, and it’s not just condos. Detached homes here dropped 10.01%, semis down 9.04%. This area is correcting across the board, with heavy inventory and lots of competition regardless of property type. Composite benchmark: $563,400.
The takeaway for Central Toronto: Don’t assume “downtown = condos.” C01 freeholds are quietly outperforming, while C08 is soft across all property types. The data matters more than the neighbourhood name.
Toronto East (E01, E02, E03)
The east continues to show relative strength, just as it did throughout 2025.
E01 (Leslieville, Riverdale): Down 5.20%, outperforming the city average. Strong community feel, good schools, and transit access are keeping demand steadier here. Benchmark: $1,039,400.
E02 (The Beaches): Down 5.04%, the best-performing area among those we tracked. Lifestyle buyers who want this neighbourhood are willing to pay for it. Benchmark: $1,281,500.
E03 (Danforth Village, East York): Correcting in line with the broader market. Still offers some of the best value for freehold homes in the 416, with a benchmark price of $1,036,700.
The takeaway for Toronto East: If you want a family-friendly neighbourhood with relative price stability, the east – particularly E01 and E02 – is delivering. Sellers here can be somewhat more confident – buyers still have more negotiating room than in 2021-2022, but don’t expect fire-sale prices.
Advice for Toronto Buyers and Sellers
Buyers:
- You have leverage. Homes are selling for about 3% below asking on average (97% of list price). Days on market have stretched. Multiple offers are rare outside of a few hot pockets. Use this to your advantage.
- Patience pays, but so does decisiveness. Yes, prices may fall further. But waiting for the “bottom” means potentially missing good properties. If you find a home you love at a price that works, the difference between January’s price and March’s hypothetical price is less important than getting the right home.
- This is the best condo buying opportunity since 2019. Motivated sellers, lots of inventory, and room to negotiate on price and conditions. Avoid buildings with excessive investor concentration and be picky about size (larger units are holding value better than studios and one-beds).
- Don’t chase the 905 for value alone. The 416 is holding better. If you wanted to live downtown but settled for the suburbs for affordability, the gap has narrowed. Run the numbers again.
- For investors: The math still doesn’t work for most properties at current prices and rents. But opportunistic buyers with capital are finding deals in bulk purchases, assignments from distressed investors, and off-market deals. The average investor is getting crushed; the sophisticated ones are quietly acquiring.
- Look at PDOM, not just LDOM. If a listing shows 30 days on market but the property has actually been listed twice before, the seller is more motivated than the stat suggests. Your agent should be checking the full history.
- PRO TIP: Ask your agent to pull the complete listing history on any property you’re considering. A home on its second or third listing attempt – especially with price reductions – signals a seller who’s ready to negotiate. That “new listing” might not be so new after all.
Sellers:
- Pricing is everything. The gap between the price homes are listed at and what they’re selling for is widening. Price too high and your home will sit, potentially requiring a relisting that buyers will notice.
- The first 14 days matter more than ever. That’s when serious buyers are watching most closely. If your home doesn’t generate interest in those first two weeks, you’re already playing catch-up.
- The market sees you. That PDOM number? Buyers and their agents can see your property’s full history. If this is attempt number two or three, they know, and they’ll negotiate accordingly.
- Condo sellers: If you’re a condo investor who’s been bleeding cash, the math is easy: at some point, cutting your losses beats hoping for a turnaround that may not come. If you’re an end-user selling to move up, price competitively from day one. Overpriced condos are sitting for months.
- The condition of your home matters more than ever. In a competitive market, buyers overlook flaws. In this market, they don’t have to. If your home needs work, either do it or price accordingly.
- Desirable neighbourhoods still sell. If you’re in W01, E01, E02, or other family-friendly pockets with good bones, you’re in a better position than the overall stats suggest.
What We’re Seeing on the Ground
Stats tell one story. What’s happening in our inboxes tells another.
Over the past few weeks, we’ve noticed a shift. Motivated buyers and sellers (the ones who’ve been waiting for “more certainty”) are getting tired of waiting. They’re reaching out. They’re ready to make moves, even if the market isn’t sending a perfect green light.
And last week? We saw some notable bidding wars. Not the 2021-style chaos with 30 offers, but legitimate competition on well-priced properties in desirable neighbourhoods. It’s early, but it made us wonder: are the buyers back for spring?
We’re cautiously optimistic about February. The pent-up demand is real, rates are holding and life doesn’t wait for perfect market conditions. If listings come to market staged, marketed and priced right, we expect buyers to show up.
The BREL Bottom Line
January 2026 confirmed what we’ve been feeling: this is a market finding its floor through time, not shock. Prices aren’t falling off a cliff, but they’re not bouncing back either. The market is recalibrating slowly, unevenly, and neighbourhood by neighbourhood.
For buyers, this is a window of opportunity. You have leverage, but only on the right listings. Use it wisely.
For sellers, realistic pricing and patience are your friends. Lead with realism, not optimism.
For everyone watching from the sidelines: the market isn’t going to send you a flashing “BUY NOW” or “SELL NOW” signal. It never does. Your home’s value depends far more on where it is and what it is than on headline stats. Make decisions based on your life circumstances, not market timing.