You know we don’t pull punches, and today is no exception. The July 2022 real estate statistics were released by the Toronto Regional Real Estate Board (TRREB) today and our fifth month of this post-pandemic market shift wasn’t pretty.

NOTE: If you aren’t thinking of buying or selling a home in the next 12 months, you might want to stop reading this blog right now, for the same reason you probably haven’t been opening your investment statements. If you aren’t actively in the market, the ebbs and flows of prices and volume don’t really impact you. Just click here for some funny cat memes.
Let’s start with the basics of the July 2022 statistics:
- Sales volume was down 47% vs. July 2021. That’s in line with what we’ve been seeing these past months.
- The average price of a home in the GTA in July 2022 was $1,074,754 – that’s up 1.2% compared to July 2021, but down 19.3% since February 2022 (the peak).
- The number of new listings was down 4% vs last year – but the number of active listings was up 57.6%. So there are more properties on the market.
- It’s taking longer to sell a home – on average, 29 days (vs 20 days in July 2021)
So we know that higher interest rates are cooling the market and that the outsized price gains we saw during the pandemic are reversing – the market is re-balancing itself and going back to the levels it “should” have been at, if COVID hadn’t messed everything up.
It’s almost like a giant post-pandemic eraser is undoing 2 years of over-performance.
Now let’s dig deeper into prices:
- The suburban parts of the Greater Toronto Area (aka the 905) continue to be more heavily impacted than the City of Toronto (the 416) – that makes sense given the 905’s above-average performance during the pandemic.
- In the City of Toronto, average home prices were down 15.8% since their peak in February 2022 – down $191,320. West Toronto performed better, with prices down 11.7% since Feb.
- In Toronto, detached homes were once again hit the hardest, down 26.9% since February – the post-pandemic eraser at work. They were also down vs July 2021.
- Semi-detached and townhouse prices performed better, down 14-15% since February, but still up from July 2021.
- Condo townhouses saw a 12.6% decline vs. peak prices in February, but were still up 6.3% vs. last year in the GTA.
- Condos were the least impacted in July, up 6.9% since last July in the GTA, but down 9.5% since February 2022
- Versus June 2022 – the average price of a home in the GTA went down 6% or $71,500.
- The pandemic eraser has taken us back to June 2021 prices.
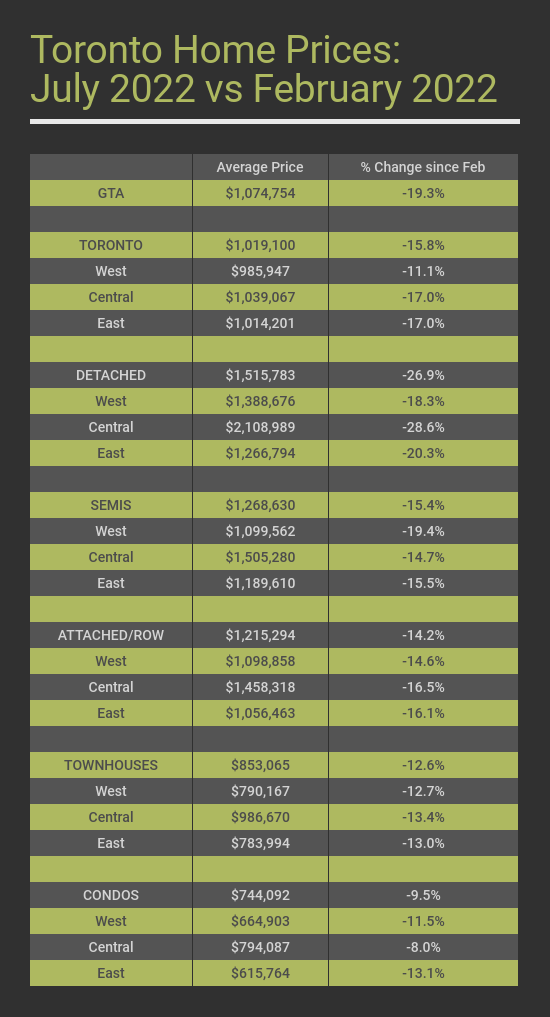
Here are the full price statistics for July 2022 vs. February 2022:
Despite prices declining over the past 5 months, it’s actually less affordable to buy a home now than when the market was at its peak in February, because of interest rates (scroll to the bottom to see an example)*. If you’re waiting to buy until we reach ‘bottom’ – remember that the bottom will likely only be reached after further interest rates hikes- which will make owning a home even more expensive.
Prices only tell one part of the story. If you want to be able to see where the market is headed, you have to look at some other real estate statistics too:
- We haven’t seen a huge influx of new listings – in fact, we saw 4.1% fewer new listings than last July. That signals that Toronto homeowners aren’t feeling desperate to get out of the market and flooding it with homes for sale. The Toronto real estate market is chronically undersupplied, and Torontonians have confidence in the market’s longer-term outlook. People lucky enough to own a home in our great city don’t seem to be in a hurry to part with it – they know the interest rate shock and inflation won’t last forever.
- In the hot years leading up to this market shift, we didn’t really talk much about absorption rates – a measure of supply and demand. It’s calculated by taking the number of homes sold in a month and dividing it by the number on the market. In July 2021, the absorption rate for Toronto was 69%; in July 2022, that number had fallen to 41%. Interestingly, absorption rates of 20% or more are traditionally considered seller’s markets.
- It’s also important to also look at months of inventory – how long it would take us to sell all the homes listed for sale on the last day of the month, at the current sales rate. Toronto currently has 3.4 months of inventory of detached houses – a lot higher than the 1.3 months we saw in February; we currently have 3.5 months of inventory for condos vs. 0.8 months in February 2022. Balanced markets – where the buyer and seller share control – typically have 4-6 months of inventory. We’re almost there.
- When we look at the trends in absorption rates and months of inventory, you don’t have to be a statistician to see that this market shift will continue over the coming months. Even if interest rates declined in September (which we know they won’t, they’ll likely increase again) – it would take us months to sell the current inventory. So settle in, folks – this ride will be longer than any of us wanted.
It’s impossible to ‘time the market’ – people who sell high/buy low are mostly just lucky. The right time to buy a home is when you need one.
So what’s next?
While I sadly don’t own a crystal ball, I think it’s safe to assume that we have a few more ugly months ahead of us – probably followed by some balanced months, and hopefully, recovery in spring 2023. The post-pandemic eraser still has some work to do.
I hope we’ll see the federal government change mortgage amortization rules – ideally to 40 years – to help current homeowners and buyers soften the impact of new, higher interest rates. I also hope they take another look at the stress test (the rule that requires lenders to qualify borrowers at 2% more than the actual interest rate). It made a lot of sense in 2017 – but forcing people to qualify at 7.69% for a fixed rate mortgage today- when they’d actually be paying 5.69% – seems unnecessarily punitive.
Remember: the government is increasing interest rates to battle inflation – they aren’t looking to collapse the real estate market. Long-term, this will all sort itself out – we’re just in the painful in-between time right now.
Thinking of buying a shifting market? Check out our latest post with advice for buyers buying during the market shift. Have questions? We got you. ****@************nt.ca“>Reach us anytime.
*Example: Affordability Has Decreased Despite Prices Declining
If you bought a semi-detached $1,500,000 house in July 2021, with a $300K downpayment, amortized over 25 years at the prime rate of 2.45%, your payment would have been $5,346 per month.
If you bought that same house today – now worth $1,275,000 – with the same $300K downpayment, amortized over 25 years at the prime rate of 4.7%, your payment would be $5,553 per month.
Affordability has decreased too. If you want to spend $2,500 a month on a mortgage payment, here’s how that changes with interest rates:
- At a 2% interest rate, you can purchase a property up to $590,000
- At 4% interest, the maximum budget for a property is now $475,000
- At 5%, that budget reduces further to $430,000
- At 6%, that budget is now $390,000
Obviously if you don’t need a mortgage and are buying all cash, then interest rates don’t affect you this way!